


Study of a 1977 Front Bumper—Part 2
August 1, 2017Comments
In 1977, a metallurgical formability team analyzed the stamping of an automotive bumper, as well as bumpers made with three steels of different strengths. The bumpers composed two sidepieces and the front center section, called the nose. In last month’s column, I described stamping the two sidepieces; here I will discuss the nose section. 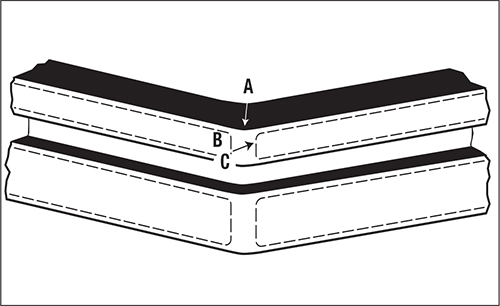
Fig. 1—Pointed front bumper (nose) to which the two-sided curved ends connect. 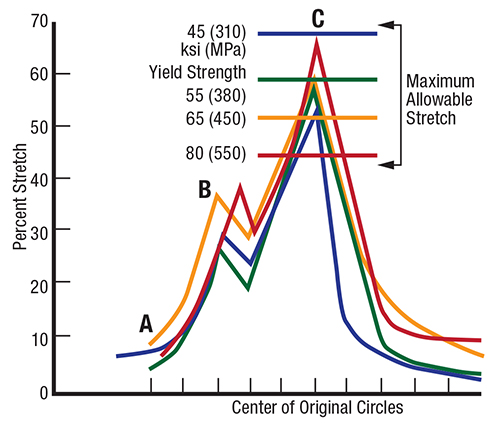
Fig. 2—Graph shows maximum allowable stretch for each of the test steels (45, 55, 65 (production), and 80-ksi yield strength). 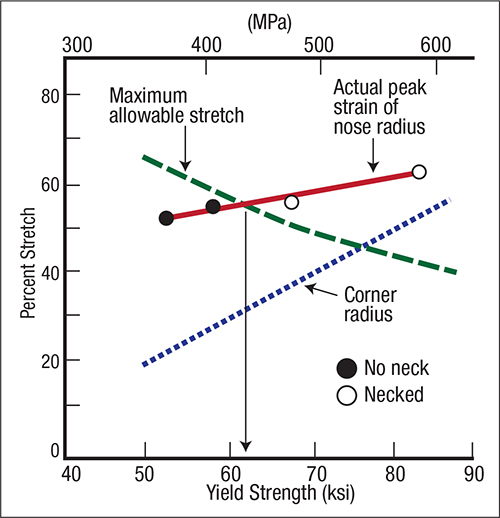
Fig. 3—Graph shows the forming limits of the corner and nose radii. 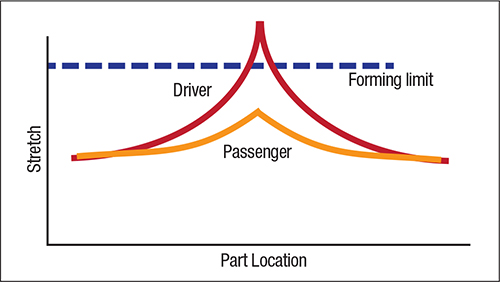
Fig. 4—Difference in final stretch capability of two corner ends from the same bumper.
The 1977 bumper differs greatly from the bumpers of today. Instead of the basically straight (flat) bumpers stamped today, the 1977 team analyzed a v-shaped bumper (Fig. 1). The bumpers were formed in a production die using high-strength low-alloy (HSLA) steels with normal yield strengths of 45, 55, 65 (production) and 80 ksi. No changes were made to tooling, lubricant or press settings. The team made major nose measurements at locations A-B-C on the center of the bumper.
The strain gradients (plotted in Fig. 2) exhibit little change for the different-strength HSLA steels. The peak strains, generated at the sharp bend radii, were strongly influenced by the constant r/t (the ratio of the inner bend radius to sheet thickness). This is in contrast to the strong influence of the yield (n-value) on the strain gradient in the corner (or bumper wraparound). The peak adjacent to location A was lower due to sheetmetal flow from the binder area. The indent in the central bumper face at location B created an embossment forming mode and restricted sheetmetal flow into the radii, causing additional stretch on the radius.
The maximum allowable strain limits shown in Fig. 2 were equal to computed FLC0 values for the forming-limit curve for the four steel grades. Note the expected decrease in allowable forming-strain level as yield strength increases.
Fig. 3 plots the maximum allowable strains and the highest peak strains as a function of initial yield strength. The plots clearly illustrate the slight increase in peak strain and the strong decrease in maximum allowable strains. Figs. 2 and 3 form a reference base for comparing other steels formed in the same die under identical forming conditions. A sample of dual-phase (DP) steel tested under the same forming conditions shows a major benefit: DP steels are lower in yield strength and higher in initial n-values, which help suppress initial strain gradients.
Having all of the necessary data, the bumper-formability team created a report that detailed the problems—such as the lack of control of sheetmetal stretching over the front bumper point—and suggested modification.
During one of the team’s final checks, it compared the strain distributions from the two side bumpers (Fig. 4). The side bumper from the driver’s side was weaker due to greater stretch that crossed the forming limit. The following morning, the team reported its conclusions to the plant manager. When he learned about the problem with the driver’s-side bumper, he asked for verification. The team took the manager out to the die and made another hit, reproducing the results shown in Fig. 4. They then rotated the die in the press and stamped another bumper. The same weak end indicated a die problem, not a press problem. MF
View Glossary of Metalforming Terms
Technologies: Materials, Quality Control
Comments
Must be logged in to post a comment. Sign in or Create an Account
There are no comments posted. Quality Control
Amrol Jr. New Starrett President and CEO, Other Executives N...
Wednesday, March 5, 2025
Ascential Technologies Appoints Divisional CEO to Specialty ...
Wednesday, April 24, 2024
 Materials
Brinell, Rockwell and Vickers Hardness Testing: Use and Misu...
Daniel Schaeffler Friday, April 1, 2022
Quality ControlTroubleshooting Sheet Metal Forming Problems, Part 2: The St...
Daniel Schaeffler Friday, February 26, 2021