


How Not To Use the Forming Limit Curve
September 1, 2015Comments
The first research paper on the forming-limit curve (FLC), presented at the 1965 International Congress of the Society of Automotive Engineers (SAE), described the right half of the new, unique curve. Laboratory analysis had determined the onset of failure for several steels by stretching various-width test strips over hemispherical punches. Stretching continued until the onset of a local (through-thickness) neck (Fig. 1, line A). Researchers plotted, on graph paper, major and minor strains measured over each incipient neck to define the failure limit. The resulting research paper showed datapoints taken from an automotive stamping with a forming failure, and from laboratory tests of the same type of steel having the same FLC. Three years later, additional research generated the left side of the FLC.
Fast forward 50 years, and research continues in search of a standard operating procedure for applying the FLC accepted by all companies around the world. Two of the major FLC applications that provide information on the press-shop floor:
• Certifying that a stamping has the required safety margin and/or troubleshooting a formability problem; and
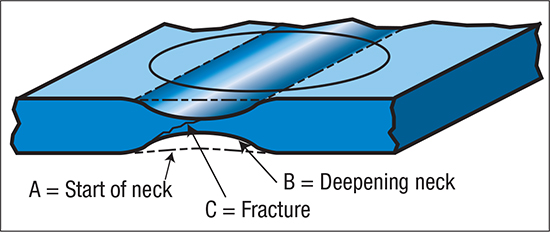
Fig. 1—The strain values for the FLC data points are measured only at the onset of the neck (A).
• Virtual forming, or computerized die tryout, where stamping and die design, product improvement and other analyses are conducted by computer analysis. Here the FLC helps to determine forming failure limits and safety margins.
Unfortunately, misuse of the FLC concept and operating procedures can cause operational problems. Here we discuss six such problems.
1) Measuring the strain values on a well-developed neck (Fig. 1, B). The FLC is defined as the onset of the local neck, which causes deformation throughout the stamping to stop while the neck continues to grow toward fracture. Measurements taken over an obvious neck will create an excessively high FLC. Before recognizing this problem, FLCs created by various people testing the same batch of steel created a wide band of FLC values that were not useful. This problem still exists.
2) Measuring strain values on each side of a torn specimen (Fig. 1, C). A tear of the local neck will cause open gaps in the steel that will vary depending on how quickly the deformation was stopped. To obtain strain values for this problem, researchers took measurements of the major strain from stretched circles on each side of the tear and plugged them into their favorite averaging equation. Since strain gradients are common on both sides of a high-strain or tear location, strain measurements on either side are not valid FLC numbers.
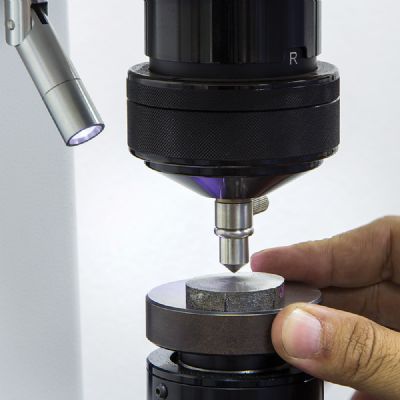
3) Initially, a tactile (finger) evaluation of the surface was performed to determine whether a neck had started to form. Many yes/no arguments ensued until all of the evaluators reached a unanimous decision. Today, many shops will use a recording camera focused on the circle and over the failure location. During normal deformation, a rather shallow line will represent the rate of strain. At the moment the local neck starts to deform, the strain localizes and strain rate immediately increases. That rate-shift point is the FLC. While this setup is rather simple for hemispherical dome testing, it can be complex in a press environment.
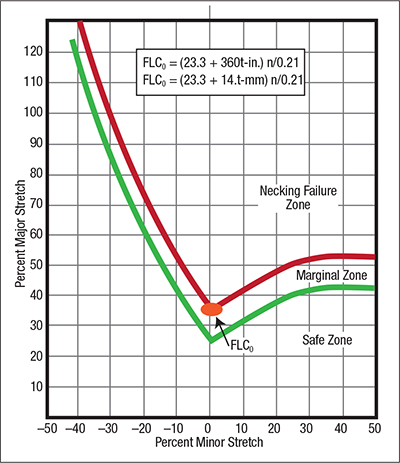
Fig. 2—Low-carbon steel uses a standard FLC configuration that moves up/down the graph as a function of FLC0.
4) For low-carbon steels, a standard shape of the FLC has been used for decades (Fig. 2). This curve moves up and down on a major/minor strain graph depending on the value of FLC0—the low point located on the zero minor-strain axis.
FLC0 = (23.3 + 360t-in.) n/0.21
Two steel properties are needed. First is the sheet thickness. While not a major effect on FLC0, it does compensate for hot-rolled versus cold-rolled steel thickness differences. The second property is the work-hardening exponent (n-value) which has a direct major relationship with FLC0.
5) Press shops often complain that the FLC is completely wrong when predicting the stretchability of blanked or sheared edges. Actually, the FLC provides the correct answer when inserting the correct n-value into the above equation. The n-value for the incoming steel is not the n-value for a location that underwent severe cold working during edge cutting. A study performed on hole expansion showed that a milled or waterjet-cut edge stretched 280 percent. The same steel with a standard sheared edge would only stretch 80 percent. These two hole expansions have very different n-values that must be inserted into the FLC0 equation.
6) Some companies have used the FLC graph to determine the forming safety factor of steel obtained with a three-sigma variation in thickness and n-value. This might be useful information, except that the process details were completely wrong (Fig. 3). A gridded sheet of steel is formed into the stamping under evaluation. Fig. 3A shows the resulting FLC curve using the blank’s t and n-values to compute FLC0. The most severe major/minor strain combination is plotted as the lower dot (X) on the zero minor axis.
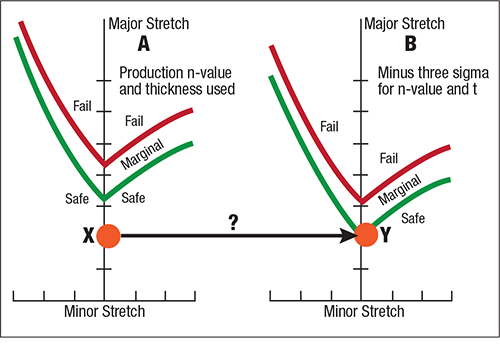
Fig. 3—The highest major/minor strain combination (X) in the actual stamping cannot be transferred, without correction, to a theoretical low-side t and n-value stamping (Y).
We modify the curve by computing FLC0 with the minus-three-sigma values of t and n-value (Fig. 3B). As expected, the curve lowers substantially. The previous major/minor strain dot (X) transfers to the same location (Y) on the new curve, indicating that the stamping remains in the safe (green) zone. However, we cannot use the value of any strain reading in the initial part for a part made with the modified steel. Thinner steel flows differently in the die, and a steel with a lower n-value exhibits less stretchability. Using this “worst-case analysis” is invalid. MF
View Glossary of Metalforming Terms
Technologies: Materials, Quality Control
Comments
Must be logged in to post a comment. Sign in or Create an Account
There are no comments posted. Quality Control
Amrol Jr. New Starrett President and CEO, Other Executives N...
Wednesday, March 5, 2025
Ascential Technologies Appoints Divisional CEO to Specialty ...
Wednesday, April 24, 2024
 Materials
Brinell, Rockwell and Vickers Hardness Testing: Use and Misu...
Daniel Schaeffler Friday, April 1, 2022
Quality ControlTroubleshooting Sheet Metal Forming Problems, Part 2: The St...
Daniel Schaeffler Friday, February 26, 2021