


Study of 1977 Auto Bumper Quite Revealing
July 1, 2017Comments
In 1977, a formability team from the steel company supplying steel for an automotive front bumper was assigned to evaluate the bumper. The goals:
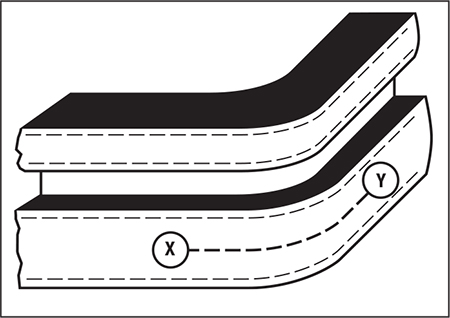 |
| Fig. 1—Two corner sections of the steel bumper. Note that the two-level bumper is separated by a depressed central area. |
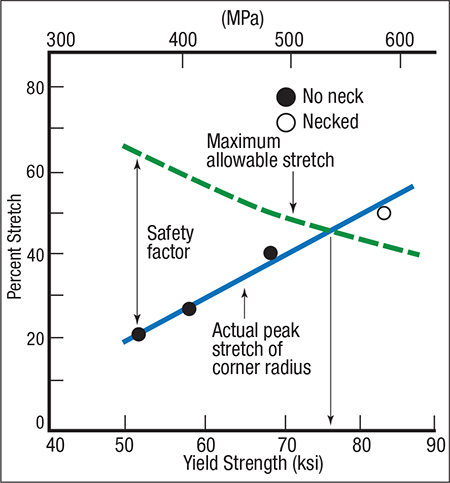 |
| Fig. 2—The maximum-allowable-stretch line (dashed) in this steel-rating graph is controlled by the forming-limit diagram. |
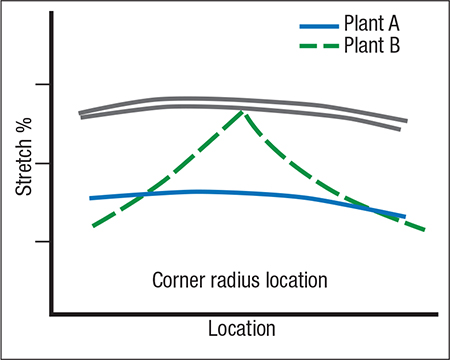 |
| Fig. 3—Plant A is producing better corner bumpers than Plant B, with fewer weak areas. |
1) Analyze strain distribution found in different auto bumpers made with higher-strength steels. The bumpers were constructed in three sections. Two corner sections (Fig. 1) attach to the center section (I’ll review an analysis of the center section in next month’s column). A highlight of the entire bumper is the deep, flat indentation formed along the center of the entire bumper to add strength.
2) Without changing any process variables, determine the effect of the material yield strength on the strain distribution and maximum allowable strain.
3) Strains in the corner radius and center section are to be tested with four steels. The yield strengths are:
Ksi (MPa)
- 80 (550)
- 65 (450)–Production Steel
- 55 (380)
- 45 (310)
Fig. 2 illustrates one way to rate the steels. This method of displaying the interaction of the peak strain and the limit strain plots both values as a function of the yield strength. The maximum-allowable-stretch line inserted in the graph is taken from the forming-limit diagram, which denotes the actual peak strain of the corner radius. The data on the graph show a straight-line plot of peak strain increasing and limit strain decreasing as the strength of the steel increases and the n-value decreases. A practical forming limit—onset of necking—occurs when the peak strain in the stamping exceeds the limit strain. This relationship is easily seen in Fig. 2. Steels with yield strength greater than 77 Ksi would be located in the red zone, ready to fail. The 65-Ksi production steel would be located at the yellow/green boundary line, thus acceptable for production.
During the test, it was discovered that the corner bumpers were being produced at two different plants. A comparison study revealed several operational differences between the two (Fig. 3). Plant A had a constant percent strain at two different levels for two steels—reflective of constant R/t bending. Plant B had a steep gradient similar to one-half of a hemisphere—indicating major deformation by stretching. This stretching thinned the corner and weakened the bumper at various locations. MF
View Glossary of Metalforming Terms
Technologies: Quality Control
Comments
Must be logged in to post a comment. Sign in or Create an Account
There are no comments posted. Quality Control
Amrol Jr. New Starrett President and CEO, Other Executives N...
Wednesday, March 5, 2025
Ascential Technologies Appoints Divisional CEO to Specialty ...
Wednesday, April 24, 2024
 Materials
Brinell, Rockwell and Vickers Hardness Testing: Use and Misu...
Daniel Schaeffler Friday, April 1, 2022
Quality ControlTroubleshooting Sheet Metal Forming Problems, Part 2: The St...
Daniel Schaeffler Friday, February 26, 2021