Forming-Limit Diagrams: Then and Now
July 1, 2016Comments
This year the forming-limit diagram (FLD) celebrates 50 years of helping improve sheetmetal forming. The FLD was developed from a 4-yr. graduate research program that sought to determine:
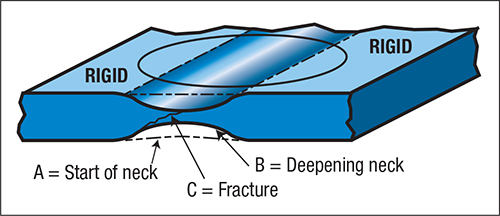
• What triggers the onset of local necking and tearing during sheetmetal forming, and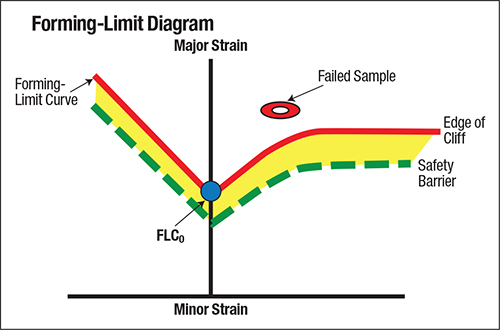
Fig. 1—A forming-limit diagram provides severity bands, the height of the bands on the major strain axis and the location of the measured strain point.
• Can the trigger be predicted in advance of actual failure?
Obtaining such early data would allow identification of stampings that exceed the forming limit and tear. Corrections then can be implemented before building the physical die.
The first paper describing the research results was presented at the 1965 SAE International Congress in Detroit. Over the years the FLD has undergone many improvements, some being forced by demands of new technology and others created by continued research.
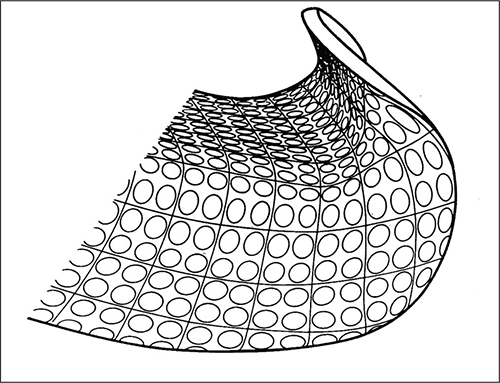
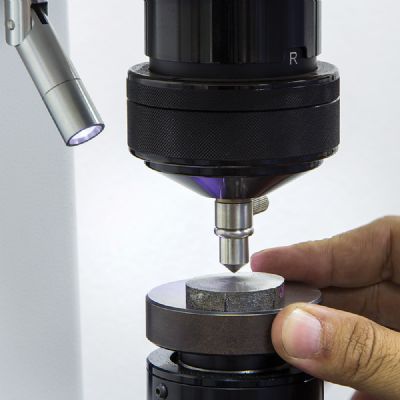
The initial research program employed a hemispherical punch to stretch clamped flat blanks etched with circular grids. A surface neck in the formed dome was deemed the onset of failure. Different materials and strengths, hemispherical-punch diameters and other variations were tested. Analyzing the data showed that sheetmetal with the same mechanical properties had the same failure trigger.
The most conclusive research tests took blanks from the same coil and etched them with circle grids. Some were tested in the lab with a 4-in.-dia. hemispherical punch, their failure strains measured. Other blanks were taken to a press shop, where stamped parts experienced tears. Both samples exhibited the same amount of strain at the failure trigger; the lab test could predict the failure of a stamped part.