Worst-Case Scenario—Good or Bad?
July 1, 2010Comments
The utilization of statistics in the press shop is a powerful tool when applied correctly. Examples include control charts, failure prediction and design of experiments. Unfortunately, severe problems are encountered when used improperly. One example is the use of raw data that is biased, measured improperly or not even related to the analysis being conducted. These data are obvious examples of the underlying theme in our last two columns—GIGO, or garbage in garbage out.
More subtle and extremely dangerous is the use of good data in a flawed application. The use of statistics cloaks the analysis with a visible scientific component that hides the underlying flaw. In the last two columns, this becomes a slightly different case of GIGO —garbage in gospel out. If the statistics are correct, the output of the analysis must be true. An example of this flawed application is the popular worst-case scenario currently found in many automotive industry die-tryout programs.
Some time during die tryout (often at the end) a stamping is made from typical production metal. The blank contains a circle-grid pattern that provides a measurement of major and minor stretch combinations everywhere in the stamping. The mechanical properties of the next blank are obtained from a tensile test. Two especially important properties are the steel thickness (t) and work-hardening exponent (n-value). These two properties set the forming limit curve that determines the maximum allowable stretch (engineering strain) for that sheet.
The forming limit curve is the upper curve in the graph. The vertical position of the curve for steel is set by the value of FLC0 obtained from the equation:FLC0 = (23.3 + 360t) n/0.21.
The equation shows a small influence of the thickness, but a direct proportional relationship with n-value. The actual major-minor stretch values from the formed stamping are plotted relative to the curve to determine the stamping location undergoing the most severe deformation (dot 1 in Graph A). Analysis of this diagram indicates the stamping location with the most severe deformation is well below the maximum allowable stretch line (FLC) or the edge of the deformation cliff.
Everything in Graph A was done properly. The most severe stretch of the stamping is assessed against the allowable stretch determined from the actual properties of the blank being formed. Many years ago, however, some engineers had a bright idea. They argued that the typical stamping plant does not als receive material with typical or average properties. Sometimes the properties are inferior in terms of formability—such as a thinner sheet or a lower n-value. Instead of using the properties of the blank actually being formed, the -3 sigma values are determined for the grade of steel being purchased. These values now are inserted into the FLC0 equation to determine the forming limit curve for the worst-case scenario. The thinner sheet and the lower n-value reduce the height of the FLC (Graph B). This procedure is still valid because the FLC in Graph B now becomes the maximum allowable stretch combinations for a blank that has the properties equal to -3 sigma steel.
To complete the analysis, the most severe stretch value (dot 1 in Graph 1) from the formed stamping is transferred as dot 2 in Graph B to determine the severity of the stamping with -3 sigma material. A fatal mistake has been made.
A die is created and spotted to the parameters of the tryout steel. Substitute a thinner sheet into that die and the steel will perform differently. Kiss blocks and draw beads will generate less restraining force on material flow from the binder into the die cavity. Die radii, punch radii, addendum, stamping features and even the global shape of the stamping will provide less restraint over material flow. Substituting a blank with a lower n-value can dramatically change the distribution of stretch. Stretch gradients will become more severe. This localization of stretch causes localized thinning that can lead to increased springback. Even worse, the thinning of the sheet and the reduction of the n-value can cause a synergistic interaction.
The bottom line? There is no practical justification and zero scientific backing to take the amount of stretch from a stamping made with one set of properties and assume that amount of stretch will remain unchanged for all the other possible combinations of properties of incoming material. Dots 3 and 4 in Graph B are possible results.
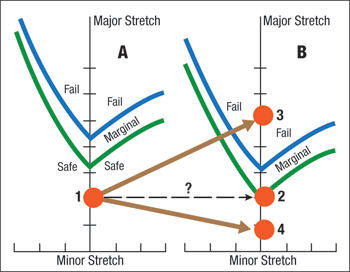 |
| Stretch state (1) from a stamping made with properties used to compute the forming limit curve (A) can not be used (2) for a stamping made with different properties (B). |
Can the worst-case scenario be used correctly? The only is to make a stamping with sheet having the -3 sigma properties. Then the mechanical properties can be obtained, the FLC generated, and the stretch from the stamping measured with all values reflecting the same event. Obtaining material with the -3 sigma properties would be difficult, if not impossible. An easy solution is to make the stamping in the virtual press shop. The -3 sigma properties are easily entered via the keyboard. The virtual version of the die is used to form the stamping. Output from the computer analysis can be automatically displayed similar to Graph A. Now die tryout can proceed in the virtual press shop without building a physical die (or two), requiring hours and hours of grinding and welding. The virtual press shop not only can correct problems caused by the worst-case scenario, but will provide additional time-saving opportunities. MF
View Glossary of Metalforming Terms
Technologies: Quality Control, Tooling