Opt for Qualitative, Rather Than Quantitative, Analysis of Steel Data
September 1, 2013Comments
Computers, electronic measuring devices, video recorders and other technological advancements entering our pressrooms often hinder our understanding of the metalforming processes. While mathematically correct, the massive amount of data spewing from these machines often is confusing, misinterpreted, overly time consuming and not useful. When it comes to comparing different types and grades of steel, often qualitative analyses of simple data will provide sufficient information.
Assume a tensile-test machine reports the n-values (workhardening exponent) of steel A as 0.213849 and steel B as 0.213122. The larger n-value (steel A) generally means more stretchability. For decades, n-value only was valid to two decimal places, but within the last 20 years the third decimal place has gained creditability—when measured under strict test procedures. Just because the computer is programmed to calculate and print three additional decimal places does not mean they contain more useful information. In our example, steels A and B have the same n-value (0.213), typical of an aluminum-killed deep-draw steel.
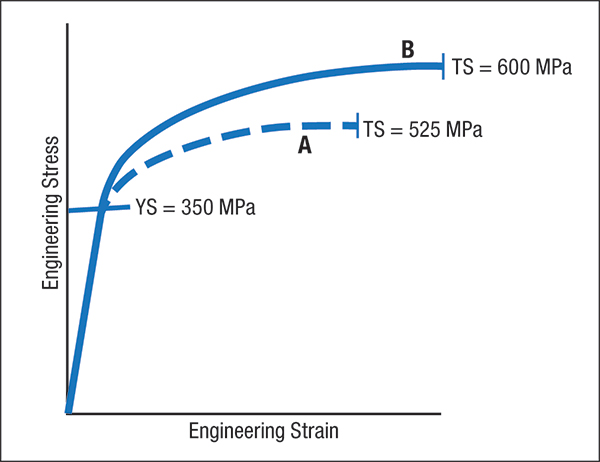
Fig. 1—For a given increment of strain, the steel with the largest increase in stress from YS to TS (steel B) has the larger n-value and greater stretching capacity.
This type of simple qualitative information often will prove more useful in the press shop than will extremely detailed quantitative data. Two candidate steels are evaluated for a part requiring extra stretchability. Both have yield strengths (YS) of 350 MPa; tensile strength (TS) of steel A is 525 MPa, and for steel B is 600 MPa. Immediately one can conclude that steel B should have the most stretchability.
The n-value of the true stress-strain curve dictates the amount of stretchability, by reducing the growth of strain gradients and increasing the maximum allowable strain combinations predicted by the forming-limit curve. The n-value is proportional to the TS/YS ratio—1.5 and 1.7, respectively, for steels A and B. Fig. 1 displays the basis for this qualitative relationship. Note the stress-strain curve of steel B climbs more steeply than for steel A. This is caused by the higher n-value workhardening the steel more per unit of strain. One can make a good qualitative decision without requiring full stress-strain curves from which the actual n-values are computed.
This simple stretchability evaluation becomes more difficult when using the inverse ratio YS/TS (0.67 for steel A, 0.59 for steel B). As n-value (and stretchability) increases, YS/TS decreases. Having all four values (n-value, TS/YS, amount of stretchability and the stress-strain increase in Fig. 1) going in the same direction is much easier to comprehend. Confusion occurs when a TS/YS value of 0.59 represents more stretchability than a steel with a higher TS/YS ratio value.