


Introduction to Strain Analysis: Measuring Strains
March 1, 2019Comments
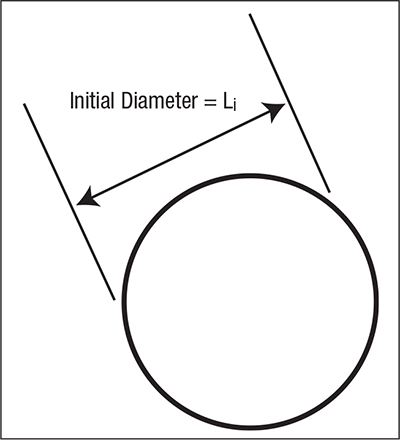 |
| Fig. 1—A grid pattern diameter of 0.200 in. is easier to measure accurately than 0.100 in., which magnifies small errors. However, you can analyze smaller features with a 0.100-in. grid. This initial diameter is denoted as Li. |
The dog-bone shape of the tensile bar increases the chances that failure will occur in the reduced section over which elongation is determined. For stamped parts, mapping locations on the flat blank to high strain locations on the formed part proves difficult. This makes it difficult to know where to place the reference marks on the blank to designate the gauge length, which has led to covering the entire sheet metal blank with a repeating grid pattern. The grid shape must allow strains to be measured in whatever direction metal flow occurs. Starting with a circle grid makes this easier. The size of the grid pattern must be such that it can capture the relatively small deformation zone, yet be large enough to be measured accurately with simple and repeatable techniques. Using circles with starting diameters of 0.100 or 0.200 in. fit this balance. These combined challenges and constraints led to the creation of circle grid strain analysis, also called circle grid analysis and abbreviated as CGSA/CGA.
To start your strain analysis, etch a repeating circle grid pattern into the sheet metal surface. The most common method: an electrochemical etch, with laser etching increasing as laser installations increase. Painting a grid pattern, though sometimes employed, is messier and the pattern might be scraped off during the forming operation. The grid pattern diameter of 0.200 in. is easier to measure accurately than 0.100 in., which magnifies small errors. However, you can analyze smaller features with a 0.100-in. grid. This initial diameter is denoted as Li (Fig. 1).
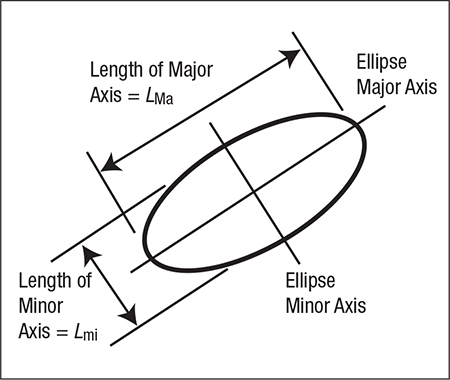 |
| Fig. 2—After forming, the circles become ellipses. The long axis of each ellipse is defined as the major strain direction. Perpendicular (90 deg.) to the major strain axis is defined as the minor strain direction. |
Next, the length of the major strain axis and the minor strain axis are measured, with these lengths after forming denoted as LMa and Lmi, respectively (Fig. 2). The percent change in length, relative to the starting diameter, represents the engineering strain in that direction, denoted as eMa and emi:
eMa = Major Strain (%) = 100 * ((LMa – Li)/Li )
and
emi = Minor Strain (%) = 100 * ((LMi – Li)/Li )
Rather than using a ruler with sufficiently fine gradations to measure each ellipse and then performing the strain calculations, an easier method involves using a clear strip with markings calibrated for the expansion from the starting circle diameter (Fig. 3). The transparent strip is placed over the formed part and lined up at the outer perimeter of the ellipse in the major strain axis. The major strain in percent reads directly as where the strip markings intersect the ellipse circumference. Then, rotating the strip 90 deg. allows for determination of the minor strain.
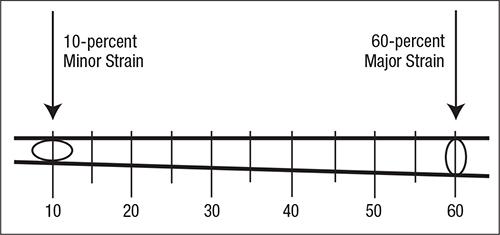 |
| Fig. 3—A relatively simple method to measure each ellipse and then perform strain calculations involves using a clear strip with markings calibrated for the expansion from the starting circle diameter. The strip is placed over the formed part and lined up at the outer perimeter of the ellipse in the major strain axis. The major strain in percent reads directly as where the strip markings intersect the ellipse circumference. Then, rotating the strip 90 deg. allows for determination of the minor strain. |
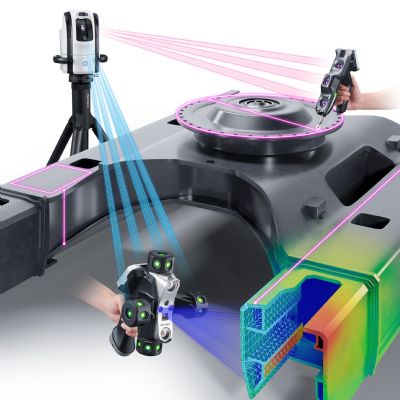
A camera-based system proves more repeatable and provides more precise measurements than the manual approach described, but can suffer from the same challenges—both require a grid pattern in sufficient contrast to the underlying metal. In addition, the camera and associated software are costlier than the tools needed to make manual measurements.
Both the manual and grid-based camera approaches can be applied on the shop floor. A newer method relying on digital image correlation is more appropriate for laboratory analysis. Here, the sheet metal surface is painted twice, first with a base white layer followed by a top layer containing small black dots. A camera follows the forming operation, with software continually monitoring the movement of each of the black dots. The computer software calculates strains in the same manner as before. Precise measurements are made over very small regions, but these measurements can be influenced by the paint-application techniques. MF
View Glossary of Metalforming Terms
See also: Engineering Quality Solutions, Inc., 4M Partners, LLC
Technologies: Quality Control
Comments
Must be logged in to post a comment. Sign in or Create an Account
There are no comments posted. Quality Control
Dave Robinson LK Metrology Talks to MetalForming at...
Kate Bachman September 19, 2024
The Future is Now: Inline Visual Part Inspection in High-Spe...
Lou Kren July 23, 2024
 Quality Control
Portable Wide-Area CMM
Tuesday, July 8, 2025
 Quality Control
CMM Boasts Digital Integration, and Delivers Speed, Precisio...
Tuesday, May 6, 2025