Daniel Schaeffler Daniel Schaeffler
President

Metal Properties: Strain-Hardening Exponent (n-Value)

January 20, 2023
0
Comments


Plastic deformation strengthens all metal alloys. Rolling in sheet production, straightening during coil processing and stamping sheet metal into engineered part shapes all are forms of plastic deformation.

The interchangeable terms strain hardening and work hardening describe the strengthening that results from plastic deformation; the magnitude of this strengthening varies based on the alloy type and the deformation severity.  Despite the terms used, this is a strengthening mechanism, not a hardening one.

Strain hardening begins once deformation exceeds the material’s yield strength and continues until the tensile-test dogbone sample or the engineered stamping either fractures or, instead, reaches the targeted strain level or part shape.

Metal Matters Fig 1 DP 340Y/590T Tensile Curve
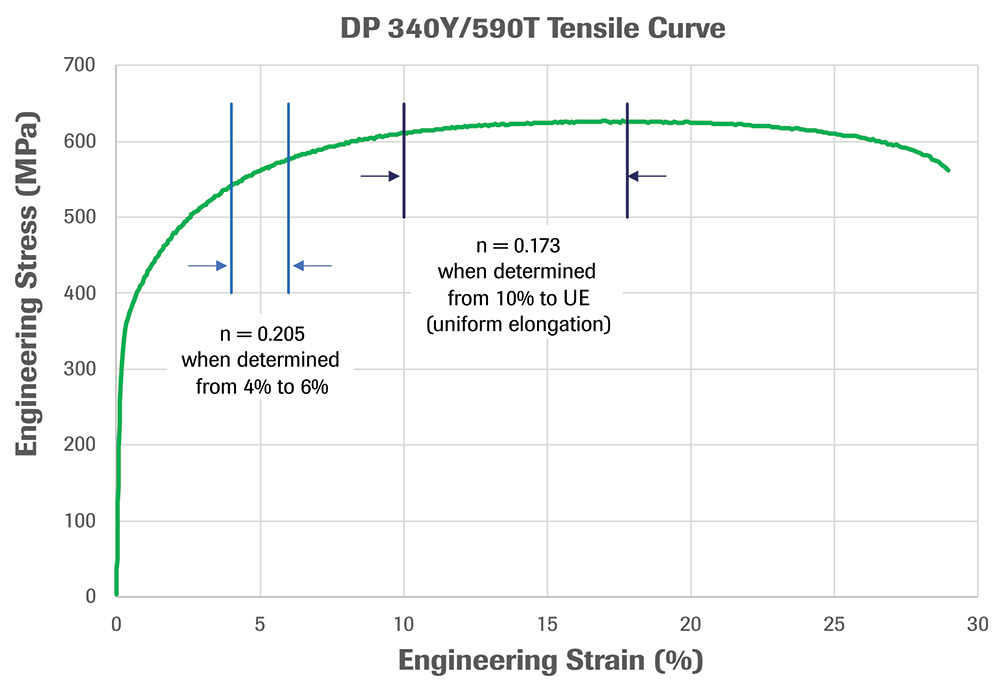
The general shape of a stress-strain curve produced during tensile testing illustrates the influence of strain hardening, with the material strengthening on the vertical axis and increasing strain on the horizontal axis. Strengthening appears to stop at the tensile strength, but this perceived peak only is an artifact of the effects of the rapidly decreasing cross-sectional area of the tensile dogbone sample overpowering the increase in strain hardening.

In 1945, U.S. Army researcher John Holloman discovered a power-law relationship between stress and strain for steels (and some other metal alloys) in the region of uniform plastic deformation, which extends from the yield strength to the tensile strength:

σ = Kɛn (eq. 1)

σ, true stress; K, strength coefficient; ɛ, true strain; n, strain-hardening exponent. 

Remember that true stress and true strain are based on the ever-changing dimensions as the sample or stamping deforms, as opposed to engineering stress and engineering strain where changes relate to the initial tensile-bar dimensions.

Determining the strain-hardening exponent (n) requires converting this equation to logarithmic form:

log(σ) = log(K) + n*log (ɛ) (eq. 2)

For metal alloys where the Holloman relationship accurately represents the flow curve, n-value is the slope of eq. 2, and K is the true stress at a true strain ɛ = 1.  

n-Value Effect on Stamped Parts

Looking at eq. 1, an n-value of 0 corresponds to no work hardening and constant stress for all strains, as any number raised to the power of 0 equals 1. Stress equals the load divided by cross-sectional area, so any deformation leading to a locally reduced thickness results in immediate failure once the applied stress rises above the material’s yield strength.

With increasing n-value, the sheet metal strengthens with each increment of strain. If the applied stress from deformation remains below the now-increased strength, the part continues to deform without necking or cracking.  Materials with a higher n-value strengthen to a greater extent for each strain increment, which is why grades with higher n-value can form more complex stampings before failing.

Areas strained from forming increase in strength greater than adjacent flatter regions. This locally higher strength helps resist deformation, with deformation concentrating in the lower-strained areas. Parts formed from higher n-value alloys experience more strengthening even in these low-strain regions, transferring the deformation further away and thereby minimizing strain localization over a larger portion of the stamping. More-complex stampings are possible by delaying strain localization in this manner.

Higher-strength steels with a lower n-value cannot accommodate as much deformation before the onset of local necking and fracture. Lower n-value also leads to a faster localization of deformation, further promoting early failure.

Some alloys, such as 3XX-series stainless steels and 5XXX-series aluminum alloys, can achieve additional cold reduction—called tempering or strain hardening—to increase strength. Accompanying this strength increase is a decrease in formability, as the cold-rolling process uses up some of the alloys’ strain-hardening capacity.

Measurement Range Makes a Difference

ASTM E646, Standard Test Method for Tensile Strain-Hardening Exponents (n -Values) of Metallic Sheet Materials, describes the steps required to calculate n-value from tensile-test data.  Although n-value derives from the slope of the log true stress-log true strain curve in strain ranges below uniform elongation, for some alloys this slope changes based on the strain range over which calculation occurs. The standard range of 10- to 20-percent strain evolved from when low-carbon steels were the primary sheet metal used in many applications.

Advanced high-strength steels such as dual-phase (DP) grades have high n-value at lower strain ranges, then level off to values approximating that of high-strength, low-alloy steels at the same incoming yield strength. A higher n-value at lower strains minimizes strain-gradient formation and is the key reason for the improved formability seen in DP steels. Some industry and OEM standards require n-value reporting at both low and high strain ranges to ensure the capturing of this characteristic. MF

Industry-Related Terms: Alloys, Form, Forming, Plastic Deformation, Tempering, Tensile Strength, Thickness, Work Hardening
View Glossary of Metalforming Terms


See also: Engineering Quality Solutions, Inc., 4M Partners, LLC

Technologies: Materials

Comments

Must be logged in to post a comment.
There are no comments posted.

Subscribe to the Newsletter

Start receiving newsletters.