Local and Global Formability—Part 2: Effects on Material Selection
April 29, 2024Comments
In Part 1 of this series (February 2024 issue of MetalForming), we addressed the effects on the press shop of forming advanced high-strength steels, in particular necking- and fracture-based failure. Here we address the use of local formability curves to support material selection.
 Ever wonder how manufacturers downgauge sheet metal components with higher-strength material? Consider a component originally stamped from 2-mm-thick DP590 steel—350-MPa yield, 590-MPa tensile strength. What should be the new sheet thickness if stamping the part from a martensitic steel, with 900-MPa yield and 1180-MPa tensile strength? Do we just use half of the thickness because its tensile strength is doubled? Or do we take approximately one-third, because the yield strength nearly is tripled? And, before going any further, we must first ensure that we can stamp the part from 1180-MPa martensitic steel without splits. We also must know how much energy the new design can absorb.
Believe it or not, we can answer all of these questions by consulting the local formability curves.
Energy-Absorbing Capacity
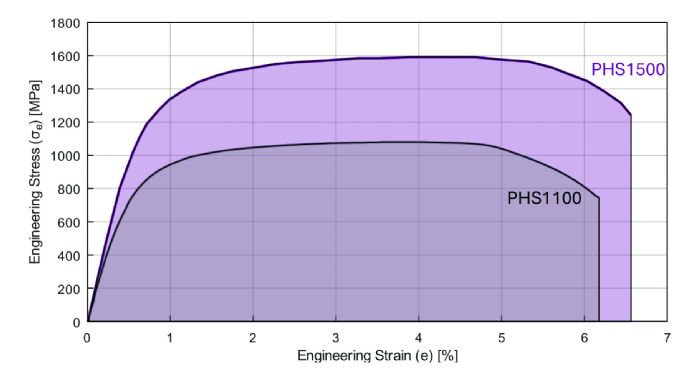
For years we assumed that a material’s energy-absorbing capacity was proportional to its area under the stress-strain curve—commonly approximated by multiplying tensile stress by total elongation. For example, PHS1500 (CR1500T-MB) steel (Fig. 1) has 1591-MPa tensile strength and 6.6% total elongation. The area under the curve (shown in lilac): 9338 MPa%. The industry approximation gives us 10,501 MPa%, a 12% overestimate. The grey curve in Fig. 1 represents PHS1100 (CR1100T-MB), a material supposedly with better energy absorption: 1188-MPa tensile strength and 6.2% total elongation, resulting in an area of 5925 MPa% and a multiplication of 7337 MPa%. In every aspect, we would expect PHS1500 to perform better than PHS1100 in energy absorption. However, drop-tower tests reveal the opposite; PHS1500 would crack earlier than PHS1100, thus absorbing less energy.
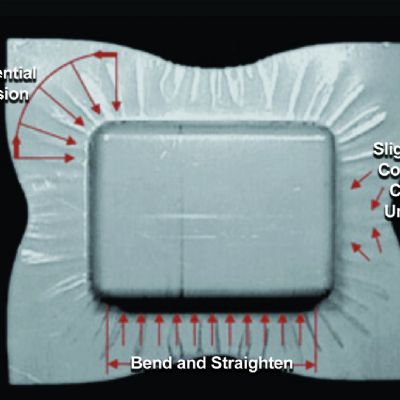
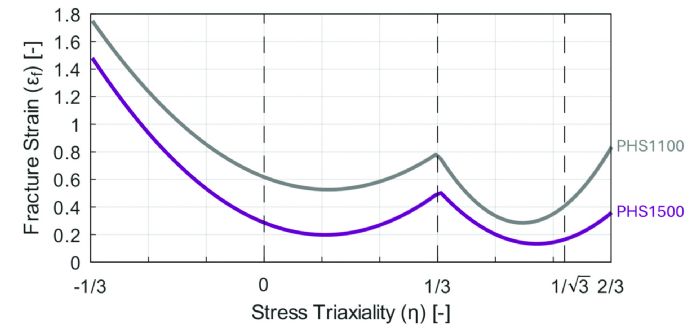 During local formability experiments, such as a VDA bending test, PHS1500 would crack at an outer angle of 40 to 45 deg., while PHS1100 can handle an angle to 80 deg. Failure curves also show that PHS1100 (Fig. 2) can handle much higher local strains than PHS1500 in any loading condition.
 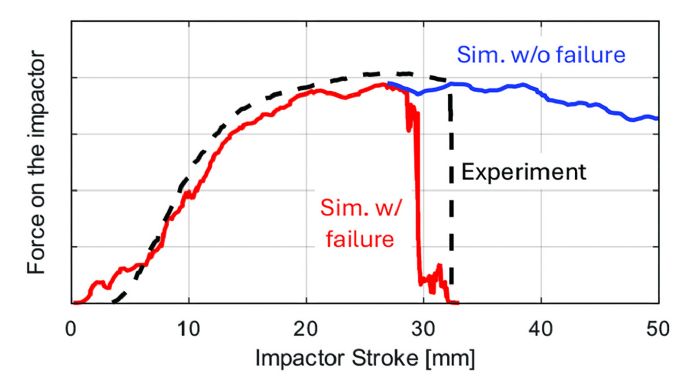 A study published by an automotive OEM (Fig. 3) illustrates how failure curves can improve energy-absorption predictions. Here, the area under the curves represents energy-absorption capacity. The study’s authors also add that geometric notches (holes, cutouts and the like) as well as metallurgical notches (spot welds, for example, if the simulation involves an assembly) must be accounted for with different models.