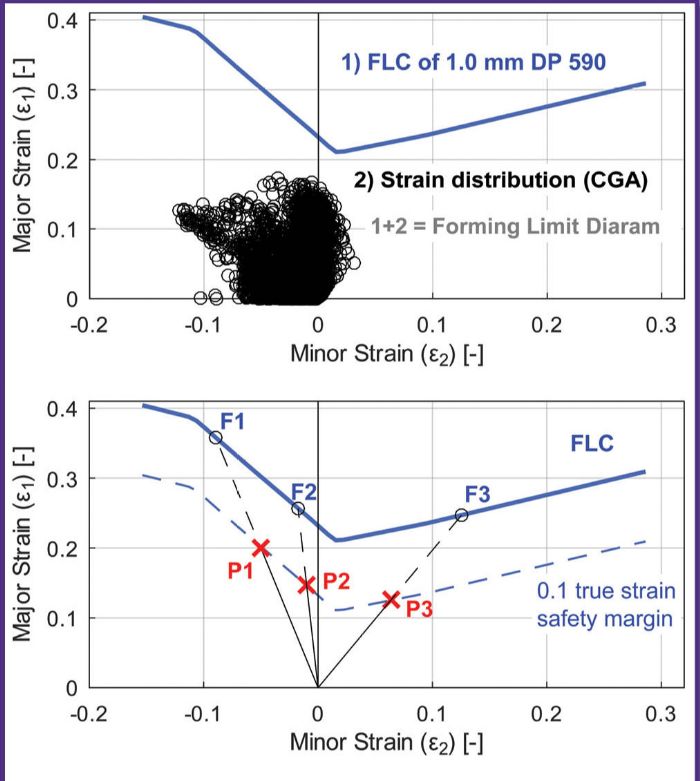
 Per Fig. 1b, all three points are on the same 10%-safety-margin curve. The thinnest point would be P3, but the maximum failure criterion would be observed on P2. So, although all three methods are used, the most common (and the safest) would be the maximum failure criterion.
Global Formability
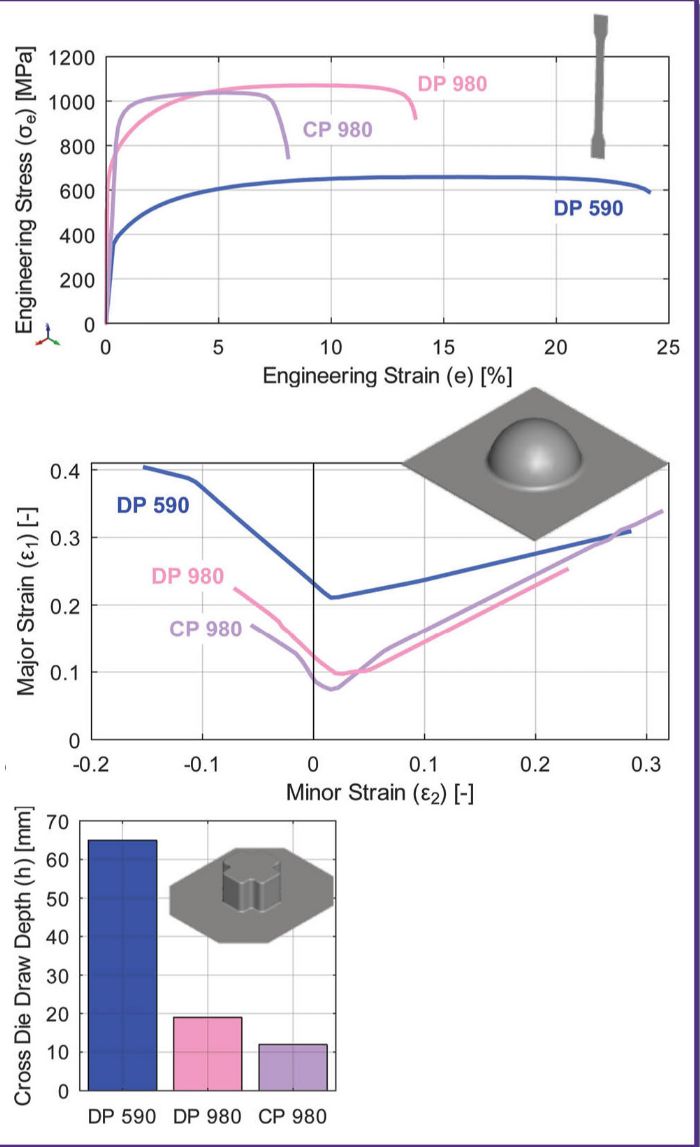
Heibel et al investigated a number of AHSS grades using several formability tests. Fig. 2a illustrates the stress-strain curves of DP590, DP980 and CP980. Notably, with a tensile strength of 980 MPa, DP980 exhibits an elongation of nearly 14%, while CP980 achieves only about 8%. In contrast, DP590 can withstand a tensile strain of 25%.
Per Fig. 2b, displaying the FLCs for each alloy, we see DP590 at the top and CP980 at the bottom. Based on both graphs, one might assume that the highest formability would be found in DP590, followed by DP980, and the lowest formability in CP980.
As expected, when subjecting these grades to deep drawing using a cross die (Fig. 2c), DP590 exhibited cracking at a depth of 65 mm. DP980 followed with a crack depth of 19 mm, and CP980 showed cracking at a depth of 12 mm. These results align with expectations. Uniform elongation (UE), total elongation, n-value, minimum point on the FLC and deep drawability all are considered measures of global formability, or resistance to necking failure.
Local Formability
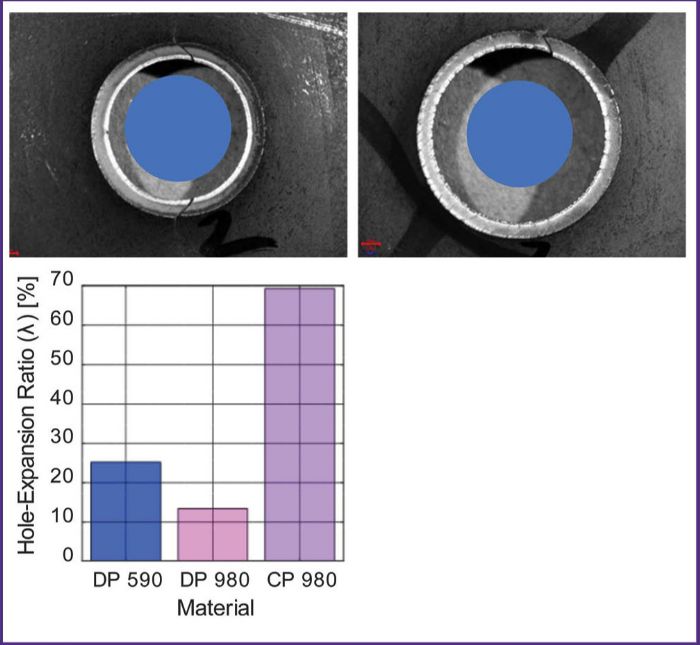
In the Heibel 2018 study, the steel grades also were hole-expansion tested. DP590 achieved a hole-expansion ratio (HER or λ) of approximately 25%. This means that when punching a 10-mm-dia. hole, expanded using a 60-deg. conical punch, a crack typically would occur when the inner radius reaches about 12.5 mm, representing a 25% increase in hole diameter before cracking.
DP980 exhibited a lower HER of only 13% (understandable given its increased strength), resulting in reduced formability. However, CP980 demonstrated an exceptionally high HER of nearly 70%. This outcome does not align with the expectations derived from Fig. 2. CP980 has the lowest FLC, and lowest uniform and total elongation values. Note: Figs. 3a-b come from a different study.
 After such observations, researchers began investigating tests to evaluate local formability, or resistance to failure by fracture, including the hole-expansion test and its resulting HER. Another option: bendability, often used to evaluate high-strength low-alloy (HSLA) steels. In some HSLA grades, steel grades considered for roll forming (such as martensitic, CP, DP and armor steels), we commonly see a minimum (inner) bending radius as a function of thickness (bendability = 2T, for example). Since the late 2000s, many European metal formers have used a three-point bending test (also called a VDA bend test) to measure local formability performance. Researchers have found that energy-absorption capacity of press hardened/quenched steels correlate well with sharp radius bending test results.
NOTE: in Part 2 of this article, we will address the use of local formability for energy absorption.
Several tests are available to estimate local formability, including hole expansion (defined by ISO 16630 and JIS Z2256); VDA bending (defined in VDA238-100); notched tensile test; and shear test. True fracture strain (TFS) in a tensile test also can be used as an indicator of local formability. Here we measure the surface area of a cracked specimen and use it in the equation:
∈TFS = ln (Ao/Af )
where A0 is the initial area and Af is the final area. A post-mortem measurement of the fracture zone is required to correctly measure the area. There also is a recent VDA recommendation for measuring the local ductility by thickness measurements, called VDA 238-110.
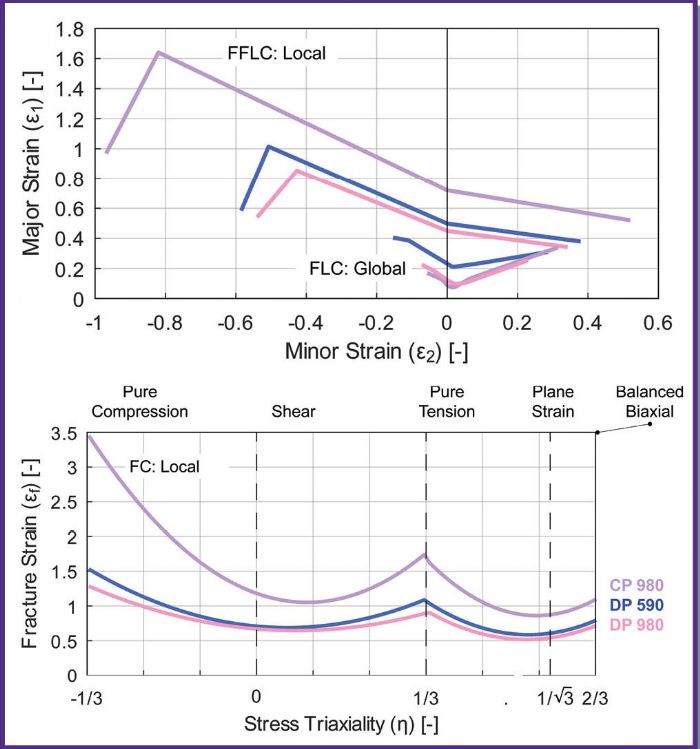 Using the various tests and calculations allows engineers to generate a failure forming-limit curve (FFLC). Another failure curve commonly used is the fracture curve (FC). In an FFLC, the X axis shows minor strain and the Y axis shows major strain, just like an FLC. With an FC (Fig. 4), the X axis shows stress triaxiality (a stress calculation beyond the scope of this article) and the Y axis shows fracture strain.
In some forming modes, including roll forming or incremental forming, the limit of formability does not relate to global formability. In roll forming, bending (by the moment created by the rolls) represents the major deformation mode. The key mechanical property to be measured: bendability. And, when simulating incremental forming, FC or FFLC methods can be used.
What may be striking in these graphs (Fig. 4) is the low global formability of CP980 and a high local formability. These properties suit the alloy well for bending, roll forming and incremental forming, and for parts containing severe stretch flanges and hole expansions. This material is not a good choice for deep drawing.
Summary of Local and Global Formability
Global formability (necking limited) refers to the ability to uniformly stretch a material, preventing issues such as necking. Once necking begins, instead of the uniformly distributed strain that once existed, the part retains the uniform and relatively low strain in most areas while concentrating the increasingly higher strains in the necking area.
Local formability (fracture limited), on the other hand, refers to the capacity to accommodate high strains without fracture. Thus, good global formability can be viewed as delaying the start of necking, while good local formability is associated with good fracture/splitting resistance.
Most lower-strength metal alloys possess high local and global formability limits, and more likely will fail based on their global formability property as that limit is reached first. When it comes to higher-strength alloys, these two limits are reduced and closer to each other, so local formability behavior may have higher importance.
For example, a DP grade may have relatively higher global formability compared to a CP or martensitic grade, but lower local formability. Thus, metal formers can stamp a DP grade but cannot expand a hole. On the other hand, a martensitic or CP grade cannot be press formed but can be roll formed and may have high edge expansion.
Global formability can be gauged using n-value or, more effectively, through UE, where n-value ideally aligns closely with UE, and total elongation. Assess local formability using various parameters, including but not limited to true thickness strain, hole expansion ratio and bendability.
Depending on your specific requirements, you should have access to data on the material’s local and/or global formability. If you’re primarily focused on deep drawing applications, having data on global formability may be sufficient. For roll forming, however, information on local formability typically suffices. Yet, if your application involves deep drawing with hole flanging or cut-edge expansions, having access to both sets of data may be necessary.
In the next part of this series, we will investigate the use of failure curves for post-forming purposes.
Special thanks to Dr. Brandon Hance and Dr. Danny Schaeffler for their help in preparing this article. �MF
Industry-Related Terms: Alloys,
Bending,
Die,
Drawing,
Ductility,
Edge,
Forming,
Roll Forming,
Scrap,
Surface,
Tensile Strength,
ThicknessView Glossary of Metalforming Terms Technologies: Materials


 The problem of “within-specs/high scrap rate” for steels increased significantly with the introduction of multiphase advanced high-strength steels (AHSS). One mode of failure, characterized by edge cracks around pre-pierced holes or blanked edges, cannot reliably be predicted using traditional methods such as a forming-limit diagram (FLD).
 Webinar