True AHSS Stress-Strain Curves
May 1, 2014Comments
The article on advanced high-strength steels (AHSS) in this month’s issue reviews new AHSS technology developed during the last five years. Increased emphasis is placed on mechanical and other properties that define what the steels can and cannot do during forming, as well as in-service performance. Knowledge about each steel type and grade allows users to match the steel to the needs of the final stamping.
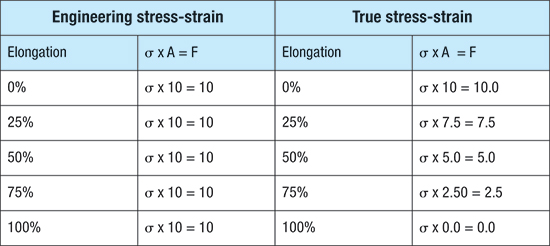
Traditionally much of this data has been obtained from stress-strain curves. Investigators place a machined long and narrow strip of steel into a tensile-test machine, which elongates the specimen while tensile force and sample elongation are recorded. Formulas allow the data to be converted into a graph (Fig. 1)—an “engineering” stress-strain curve used for product specification, tool design, material selection and other applications. To calculate engineering stress, we divide the force (F) by a constant value —the initial crosssection of the sample (A0). Strain (stretch) represents the elongation (∆L) of a gage length marked on the sample divided by the initial gage length (L0). Stress and strain measurements provide the yield and tensile strength, uniform elongation and total elongation of the material being tested. Today, stampers require more-sophisticated analyses and data, due to the dramatic increase in the number of AHSS grades and their higher strength and more complex property modifications during deformation. Now, “true” stress-strain curves are needed. (No, that does make engineering curves flawed, only a source of different information.) We calculate true stress by dividing force (F) by the instantaneous crosssection of the sample (A). Likewise, strain is the elongation of the gage (∆L) by the instantaneous gage length (L). Why the difference? The engineering stress-strain curve does not provide the energy change required to deform the steel. Pulling a tensile sample shows the difference: σ X A = F, where σ is a constant flow stress of the steel. Why the strong interest in energy to deform? Fig. 2 shows the energy curves for two 350-MPa yield-strength steels—a traditional high-strength low-alloy steel and a dual-phase (DP) AHSS. The area under the true stress-strain line represents the amount of energy required to achieve the given amount of strain—0.125 true strain or 13-percent engineering strain. Deforming a DP steel to the same strain would require an extra amount of energy (shown in blue). The tensile test only allows the curve to reach the uniform elongation or ultimate tensile strength. At that point the tensile sample begins a diffuse or width neck and the pulling stress is decreasing (Fig. 1). The curve can be extended by creating an equation to define the existing curve and then extending the curve to higher values of strain. Another research process mechanically extends the deformation to higher true strain values.
The amount of energy consumed is critical in metalforming. 1) Energy is a cost item supplied by the electric company to the electric motor to maintain flywheel speed in traditional presses, or the charging of the capacitor in servo-driven presses. 2) Forming stamped parts requires energy. Increased force or length of press stroke can increase energy use, as can an increase in strokes per minute—this creates additional heat in the die. The increase in die temperature lowers the viscosity of most lubricants. Excessive heat can cause vaporization of lubricants, leading to galling, scoring or even a die freeze up. Technologies: Materials, Quality Control
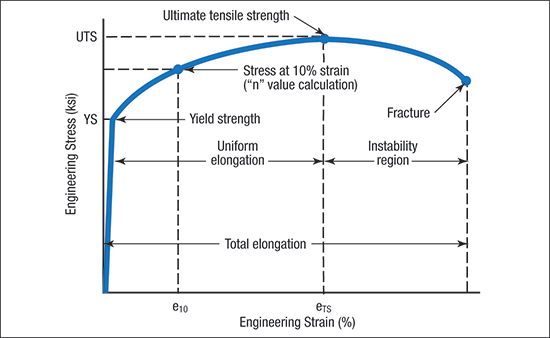
Fig. 1—The engineering stress-strain curves have historically been used to describe how traditional mild, HSLA and other steels deform.
 The true stress-strain numbers are more logical. As the crosssection of the sample narrows, the force to continue elongation decreases. For almost zero crosssection (near the end of elongation) almost no force is required to continue deformation—certainly not the maximum force required to deform the full amount of crosssection. The full analysis also provides for an increase in the flow stress of the steel as it workhardens. We use the true stress-strain curves to compute the rate of workhardening, or n-value, of the steel.
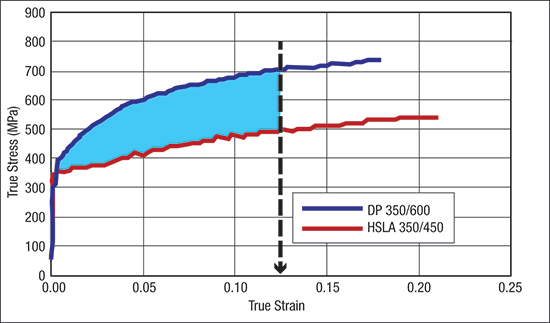
Fig. 2—The area under the true stress-strain curves more accurately describe deformation of HSLA and AHSS alloys. The blue area represents the added energy required to form the DP steel to the same strain as the HSLA steel.
View Glossary of Metalforming Terms