


Forming-Limit Curves Becoming More Important
March 1, 2015Comments
For many decades the tensile test has been the prime source of sheetmetal mechanical-property and formability data. Yield and tensile strength and uniform and total elongation became familiar terms. Next came modulus of elasticity, workhardening exponent (n-value) and strain-rate sensitivity (m-value). While useful for certain applications, these properties are restricted to a strip of sheetmetal pulled in tension. Most metalforming is biaxial stretching in the plane of the sheet. Other forming can be in compression.
In the late 1950s, a research project was initiated to answer two questions: 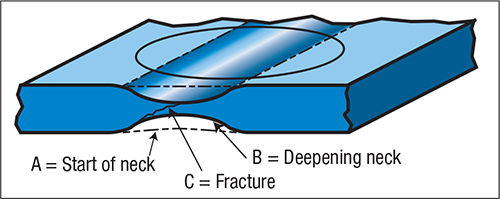
Fig.1—The onset of the local neck (A) represents the failure limit for the stamping.
• How does sheetmetal fail?
• Can the failure be predicted ahead of time?
To answer these questions, researchers built an 8-in.-dia. hemispherical punch and die to stretch a series of 10-in.-long test strips, 1 to 8 in. wide in 1-in. increments. They centered the strips, of varying material types, in the die and locked their ends by draw beads to stretch them into a hemispherical configuration. The specimens had a photo-printed circle-grid pattern to enable measurement of deformation strains.
Unlike a standard tensile test, the series of test strips duplicated the range of biaxial deformation found in real-world stampings. The strips were stretched until researchers observed the onset of necking. If the test was stopped when one side of the specimen showed a faint neck, the “ghost” of a neck on the opposite side of the pole was measured for the strain value of the onset of the neck. 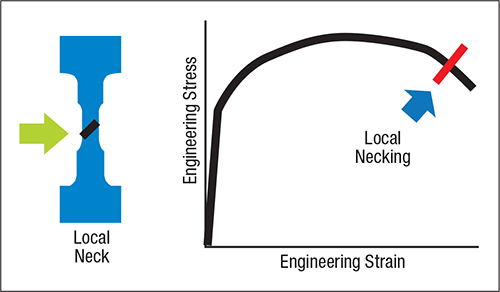
Fig. 2—Local necking failure occurs prior to total elongation fracture.
Fig. 1 shows the sequence of the necking. Ideally, strain state A was captured and measured. This is the start of a long neck in the sheetmetal called a local neck or through-thickness neck (B). It’s important because the material in the neck gets wider and thinner, causing the surrounding material to stop deforming—a key point in forming the sheetmetal.
The neck continues to thin by shear bands (C) until fracture occurs, representing total elongation in the tensile test. The speed of thinning depends on the material type and its microstructure. Inclusions, precipitates, grain boundaries and other features can accelerate early fracture. These tests generate the forming-limit curve (FLC).
Fig. 2 shows the onset of local necking on the traditional stress/strain curve. Necking occurs prior to the total elongation fracture. Attempting to detect this local neck from the tensile-test curve is not worthwhile because it only duplicates the first test sample of the FLC.
The upper curve of the graph in Fig. 3 is the FLC. We obtain its data points from the test strips with deformed circle grids. The final curve is a summation of numerous tests. Any stamping with a major/minor strain combination above the curve is subject to failure. Increasing the data point distance above the curve indicates a greater percentage of failure. 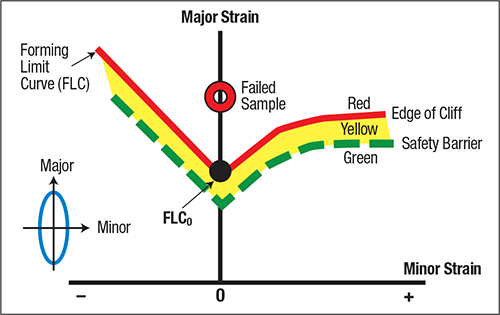
Fig. 3—Any circle grid with a combination major/minor strain above the FLC is a potential failure. Just over the limit is a five-percent chance of failure. Moving up the major strain direction increases the percent failure.
The forming-limit diagram (FLD) contains the FLC, the yellow marginal warning zone, the green safe zone and data points from the stamping being studied. After many years of testing, the results show that for many steel types the curve moves up and down the vertical axis depending on the value of FLC0. For low-carbon steel, we obtain FLC0 from an equation containing the sheet thickness and n-value from the tensile test. Why the n-value? Increasing n-value increases the amount of workhardening that delays the onset of the local neck. This allows the FLC to be determined for a given steel sample without conducting the hemisphere-dome tests.
Circle-grid analysis still finds use during die tryout and buyoff, troubleshooting and other studies in press shops around the world. FLCs represent the forming limits for virtual forming analyses (computerized die design and tryout). Virtual forming is constantly growing as industries move to higher strength steels and advanced high-strength steels. Part consolidation, tighter dimensional specs, drastically reduced die-tryout time and cost, loss of tool and die experts, light-weighting and other demands make virtual forming a standard procedure for many stampings. Having FLCs based on an equation with sheet thickness and n-value is the ideal match for virtual forming. MF
View Glossary of Metalforming Terms
Technologies: Materials, Quality Control
Comments
Must be logged in to post a comment. Sign in or Create an Account
There are no comments posted. Materials
Custom-Rolled Aluminum Coil and Full Metallurgical Staff
Thursday, June 5, 2025
 Materials
Novelis Tests Industrial-Scale Use of Hydrogen in Aluminum-R...
Friday, February 28, 2025