Managing the Timeline
Many factors and activities contribute to the final form of any product, but in the end it’s the role of manufacturing to fill the pipeline with high-quality profitable products. The three main practices of efficient timeline management:
1) Agility—the ability to move with quick, easy grace and having a quick, resourceful and adaptable character.
2) Flexibility—characterized by a ready capability to adapt to new, different or changing requirements.
3) Manufacturing Speed—swiftness, or rate of performance or action.
Optimizing these three attributes allows fabricators to achieve world-class responsiveness, able to satisfy not only current market demands but future demands easily and quickly. Efficient timeline management will dramatically reduce work in process (WIP) and shrink rework and scrap to next to nothing. And, the value added by manufacturing will reach peak levels.
Process Cycle Efficiency
Since speed is the primary means of shortening the timeline, the question fabricators must ask is, “How fast is fast and how slow is slow?”
To answer that question, we first must gather information about “value-added time”—the time required to finish the product, and “total lead time”—the elapsed time between order and payment.
Process cycle efficiency = Value-Added Time/Total Lead Time
To be considered worldclass, the generally accepted ratio of value-added time to total lead time is at least 25 percent. With this calculation, we can determine process cycle efficiency and gauge performance measures such as cost reduction, process velocity and improved cash flow.
As an example, consider a experience at Company X, which:
• Manufactures all of the parts needed for assembly one week ahead of use;
• Fabricates approximately 100 parts per assembly;
• Requires an average cycle time to manufacture each part of 1 min.-45 sec.; and
• Requires 15 min. to assemble the parts, start to finish.
This example gives us the following result:
Value-Added Time for Operations = 100 parts x 1 min.-45 sec. = 2.9 hr.
Value-Added Time for Assembly = 1 assembly x 15 min. = 0.25 hr.
Total Value-Added Time = 3.15 hr.
Total Lead Time = 7 days x 24 hr. = 168 hr.
Process Cycle Efficiency = 3.15/168 = 1.9 percent
In this example, it takes 168 hr. to stick 3.15 hr. of value into the product. That means the material sits idle for 165 hr., adding nothing but cost to the seller and consumer. Someone must absorb the cost accumulated by the 165 hr. of nonproductive time. If a company can increase process cycle efficiency from 5 percent to 25 percent, it will reduce manufacturing overhead and cost of quality by 20 percent—that’s huge.
A Kanban Story
The key to lowering the overall cost of manufacturing is to let market demand pull production through the factory, just in time. This proven approach frees up capital for a fabricator to use more productively, rather than having it tied up in unnecessary WIP and raw material. The case history that follows will detail how one company achieved dramatic increases in productivity and cash flow by installing a kanban system to organize production throughout the shop.
Kanban is a simple, efficient and highly visible to authorize movement and production of purchased and manufactured material through a manufacturing process—without the use of hard-copy purchase orders and shop orders. Literally translated, kanban means card or signal. A lean, just-in-time shop uses the kanban card as a visual cue to authorize each step in the manufacturing process, by sending a signal to the upstream operation indicating that the next operation is ready to receive material. This kind of pull-through process contrasts with push-production formats, in which a purchase order or shop order authorizes suppliers (external or internal) to deliver raw materials or work in process to the shop floor location on a predetermined date—ready or not.
In general, good management will limit the number of kanbans to provide an acceptable amount of inventory in the system. Then, by using trial and error to gradually reduce the number of kanbans, managers can fine-tune JIT throughput by identifying manufacturing constraints and prioritizing logistics. This process will optimize production and minimize the amount of raw material and WIP in the system.
Case Study: PM-Luft
Swedish manufacturer PM-Luft (grain coolers and rice conditioners) has slashed lead times in product assembly by 20 to 40 percent, while reducing WIP proportionately. How? By using kanban practices in concert with a newly installed Salvagnini order-processing system (OPS) and two new flexible manufacturing systems (FMS). Each FMS features two storage towers, a robot unloader and conveyors. And, while the new systems were reducing manufacturing time and costs, product quality improved.
For years the company had struggled with high WIP costs and long setup times related to batch production. Now it has begun the transition toward worldclass manufacturing.
PM-Luft employs a simple form of kanban based on barcodes. Each empty container entering the assembly line carries a barcode label containing all of the program information for processing a specific part. An inline barcode reader automatically reads the code on the tote, signaling the automatic production of a predetermined number of parts by its punching/shearing machines and panel benders. When the program is opened, the following sequence occurs:
1) Previously specified material enters the sheetmetal-processing line from one of the two material-storage towers.
2) The individual sheets are delivered to the line in a single piece-part flow and in a mixed-model fashion.
3) Once the appropriate material is introduced into the punch-shear combination machine, it automatically is centered, punched and sheared before it moves on to the next operation.
4) Depending on the production information in the program, the part is assigned to the automatic stacker, sorted into bins (if small parts) or sent on to the panel bender.
When the punch-shear machine sends a part number directly to the panel bender, the tooling setup in the bending machine will be ready for all required bending operations. This brings setup time to exactly the level desired—0 sec.
PM-Luft also uses its barcodes to assist with paperwork and inventory tracking. Kanban cards (bar codes) are read and automatically entered into the OPS system, which functions as a levelized scheduling tool. Each slot represents a given allotment of production time (takt time).
The kanban system and Salvagnini’s automated production line enable PM-Luft to be exceptionally responsive to customer needs. Since installing the processing line, the firm has significantly improved product quality and now produces manufacturing output matched to the rate of demand. In addition, the kanban system provides PM-Luft with minute-by-minute flexibility on the production floor, so it can respond to any volume and variety of product with ease.
The Kanban Equation
Daily demand x (order frequency + lead time + safety time)
Number of kanban = Container quantity
Daily demand represents the number of parts to be produced in a given day. I imagine that most sales forecasts reflect seasonal demands, so a recalculation of the number of kanbans is vital to effectiveness as demand varies over time. A shop manager must try to predict the demand curve with the help of historical trends, recording the actual number of kanbans used for each product over the season.
For example, the X cabinet will have 10 kanban cards from January to March, 15 kanban cards from April to October and 12 kanban cards from November to December. This shows that demand peaks from April to October. Perform this calculation at least once per month.
Order frequency represents the rate of material consumption over time, determined by dividing one day by the number of setups per day.
For example, one day divided by 0.25 setups/day equals an order frequency of four days. Normally you can determine if the part is a kanban product or not by looking at order frequency. A part with an order frequency that stretches over a long period (more than seven days) will cost more to keep in stock than if it was processed in a single-piece flow.
Lead time is the time required for delivery once a kanban has been authorized for production. Factors that influence lead time:
• Number of orders in queue ahead of the customer’s new kanban
• Machine cycle time
• Quantity
• Changeover time
Lead time, expressed in days or fraction of a day, is only an estimate, due to the four previously mentioned factors. Shops must monitor and update these influencing factors to ensure they have the correct number of kanban cards.
Safety time, expressed in days or fractions of a day, is the time allotted to compensate for unexpected events that can occur—machine downtime, scrap, no operators and variation in demand.
Container quantity is the number of products that a pallet or a container will hold, expressed in units.
The Ability to Make Any Part, Any Minute
When a manufacturer can reduce changeover times and run smaller batches (including one-piece flow), it has the ability to produce what a customer needs when he needs it. Gone are the days when you had to either attempt to forecast demand or wait for orders to come in before determining what parts to make, create drawings, cut sheets to fit on the turrets and create dynamic nests. The key to success: The ability to make any part, any minute.
Typically, customers start looking at new automated fabricating equipment to alleviate capacity issues, high costs and the difficulty experienced in moving parts in a synchronous flow. Big problems really occur every time a special is entered into the system, creating disruptions along the whole chain of operation from design to assembly.
Some fabricators have arranged machines in manufacturing cells. When done properly, they experience a much smoother process in the timeline from order to fabrication of parts to final assembly. However, a cell oftentimes cannot handle all of the parts in a synchronous flow. According to several studies, most fabricators run about 20 percent of their parts in a synchronous flow, the remainder in a batch system.
To satisfy today’s market demand, it’s vital to investigate the possibility of automating the entire process to accelerate time to market. The fact that a new automated system can cut lead time in half is attractive, since the greatest advantage over competitors is delivery time, design and cost—or agility, flexibility and speed. The gains of an automated system compared to conventional production systems are a decrease in the timeline from order to invoicing, which means a fabricator can:
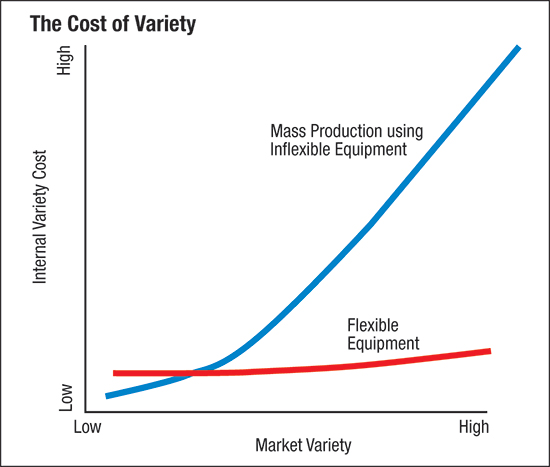 |
Fig. 1
|
• Run with practically no WIP.
• Redesign parts for a lean approach, so that part production and assembly can be accomplished in hours instead of days.
• Test new models in weeks instead of months.
• Reduce the amount of material used to build one unit by incorporating several parts into one.
• Increase the value-added percentage by eliminating all unnecessary parts handling and transportation.
• Reduce scrap.
• Make design changes (radius bends, hems, better accuracy) that can reduce the number of operations and increase the aesthetic value of the unit.
• Operate in an unmanned mode.
• Reduce man hours/part.
• Improve product quality.
Electronic Design Automation: An HVAC Case History
In another case, an HVAC company using conventional production methods (turret presses and press brakes) was experiencing major bottlenecks and inefficiencies. The crux of its problem lay in an expansive product line consisting of 23 different models that could be customized from an assortment of more than 2000 product options. To compensate for long lead times caused by an inefficient system, it countered by keeping a large number of parts in stock to act as a buffer. As a result, a lot of cash was tied up in inventory.
Salvation came via a plan to automate all design work, so that as orders come in an office clerk receives a checklist of options from sales, registers the checklist in the computer (using Salvagnini EDA-OPS software) and assigns a delivery date. With all order data entered, the software kicks out engineering drawings, a bill of materials, machine files (CNC), routing slips and sheetmetal flat patterns (DXF).
In choosing an automated design tool in concert with a new punch-shear-bend line with material-storage towers, the company reduced design time from weeks to seconds.
Why Automate the Design Process?
Automated design makes it possible to scale and configure complex models, perform engineering tasks, generate CNC code and provide the paperwork needed to produce any one of millions of possible product designs, all within seconds. And, having established the design logic system, anyone in the plant can be empowered to design the product, even those unfamiliar with the CAD environment.
Companies benefitting from electronic design automation are those that:
• Design and manufacture kits of parts.
• Thrive on providing custom-engineered solutions.
• Have a large amount of work in process.
• Want to increase responsiveness to market demands.
• Struggle with the on-time delivery.
• Frequently change designs.
• Need to generate more accurate sales quotes and proposals for custom product.
• Require consistent application of design rules across the board.
Automating the design process requires a generic CAD solid model or parametrically written program, created so that design rules can be applied. Often, small changes can be made to existing models to prepare them for automation.
A standard design rule is an instruction or mathematical formula that manipulates the CAD model or parametric programming feature based on certain conditions. Such a rule might say, for example, “The center of this hole als will be located 1 in. from this edge, but the diameter may change. And, if the part is smaller than 6 in. the hole is deleted.”
The design package eliminates the inefficiencies of repetitive tasks and calculations by allowing an engineer to define the design intent, and by letting the automated design software parametrically manipulate the model and its features.
The Wasteful Costs of Batch and Queue
If you view your manufacturing unit as an internal supply chain, with goods flowing through the process in a life-or-death competition with low-cost-labor countries, you’ll quickly see why lean manufacturing has become so important. The top domestic competitors tend to be those who have successfully pursued supply-chain agility in a just-in-time, customization environment. Supply-chain agility focuses on inducing increased velocity and flexibility throughout a manufacturing system, to enable quick response to changing market demands. Unfortunately, too many U.S. companies are stuck in an inflexible batch and queue production mode made largely irrelevant (and costly) by the pressure of small job lots and expanded product lines.
To determine the cost of variety in your factory, take your best product (one with no variety) and assume that you produce only this product during the year in the same volume as your current total operation. Compare the cost of producing that single product to the cost of your normal annual operations budget for all products. The difference between these numbers represents the cost of variety (Fig. 1).
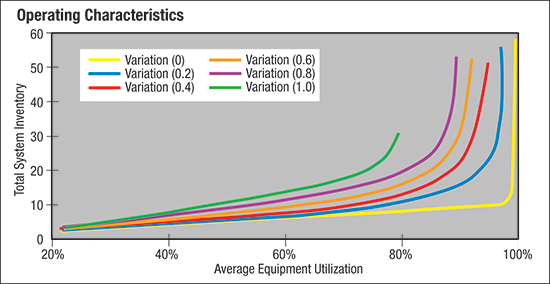 |
Fig. 2
|
Even though I continually stress agility, flexibility and speed, there is a point of diminishing returns. As a general rule, cap equipment-capacity utilization at roughly the same rate at which product variability increases. While it’s possible to maximize machine utilization, even the most flexible processing line has its limitations.
For example, consider a simple 10-station production line with inventory between each station. Cycle time averages 1 min. ±0.2 min., per station, and at the end of each operation the workstation immediately sends the part downstream and begins to work on the next part.
At a low load rate the line is perfectly balanced. But, inventory occasionally builds up between the stations because of the 0.2-min. cycle-time deviation. At low utilization rates each station has time to finish its work, and inventory rarely builds up between stations. At around 80 percent of capacity, inventory between stations does increase somewhat, but in a modest and linear fashion. However, as the load on the line increases to 85 percent and above, the rate of inventory begins to rise rapidly. Approaching 100 percent capacity causes a bottleneck.
Here we’re only dealing with one 0.2-min. variable. In actual practice, the number of production variables is much higher. And, as we accommodate more variables the shape of the machine-utilization graph shifts. With a perfect balance and zero variables, we see a straight line as we move from 0- to 100-percent utilization, with inventory increasing linearly until all stations are occupied. Once we cross the 100-percent level, the system builds inventory.
Increases in variability above zero will generate more hyperbolic curves on the graph (Fig. 2) The maximum practical capacity of the equipment declines as we add product variability. The greater the number of variables the faster inventory accumulates and the sooner the system reaches panic mode.
One of the Most Important KPIs
In a perfect world, a lean system would have zero inventory and products manufactured to order. In a truly lean enterprise, the inventory turnover rate can therefore be defined as infinite.
This brings us to one of the most important key performance indicators (KPIs) of all: inventory turnover rate. According to a variety of sources, the top 25 percent of U.S. manufacturers achieve only 29 or 30 finished-goods inventory turns per year—not an encouraging statistic, but one that provides plenty of room for improvement.
Calculate inventory turnover by dividing the cost of goods sold (COGS) for the reporting period by the average value of inventory on hand during the period. Because this ratio measures annual inventory turns, it usually is calculated once per year.
Inventory turnover = COGS/Average dollar value of inventory on hand
Inventory consists of raw material, work-in-progress and finished goods, and I recommend the same approach for calculating the turnover rate for each of these. Als calculate the average dollar value of the type of inventory you want to measure and divide that into COGS.
For example, if your product consists of 45-percent sheetmetal, calculate the value of your sheetmetal parts in your COGS and divide it by the average dollar value of sheetmetal inventory over the measurement period. Inventory turnover reflects the rate a company flushes inventory from its system within a given financial reporting period and is a direct measure of a company’s most important liquid resource—cash.
When manufacturers consider new capital investments, the effects on inventory should be one of the prime parameters for payback calculations. If you compare all of the numbers, you will usually find that the value of the increased inventory in an inflexible system may be greater than the cost of the new equipment—instant payback. MF Industry-Related Terms: Run,
Scale,
Scrap,
Bending,
CAD,
Case,
Center,
CNC (Computer Numerical Control),
Edge,
Form,
Gauge,
Lead Time,
Lines,
Model,
PalletView Glossary of Metalforming Terms
See also: Salvagnini America, Inc.
Technologies: Bending, Management


 Most of my professional life has been spent working in Europe with different kinds of sheetmetal fabricators, and I was very pleased when I had the opportunity to travel around North America studying the things were done here. I knew that all of the ideas regarding mass production, lean manufacturing and Six Sigma were formalized and championed in the United States by people like Ford, Taylor, Deming and Jack Welch, the legendary CEO of GE. And while these disciplines have evolved and been optimized as time has passed, the basic ideas remain valid.