Informed Process Selection
Forward prediction, based on Fig. 1, allows designers or process experts to try what-if scenarios to inform decision making, such as:
- What surface-angle restrictions should be applied in design?
- Can layer thickness be increased to reduce build cost?
- Where should a part be positioned and how should it be oriented in the build chamber?
The probabilistic model predicts the distribution of expected results, providing insight into the expected performance as well as the expected consistency.
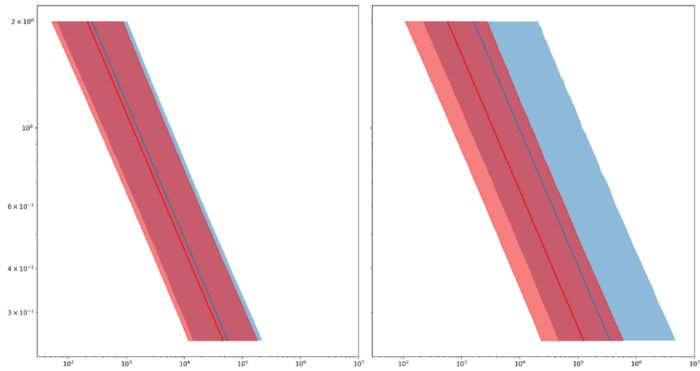 A what-if scenario (Fig. 2) demonstrates tradeoffs between design and surface-finishing technique. In the as-built condition (Fig. 2, left) the predicted fatigue performance for a 45-deg. downskin (red) is slightly worse than that of a vertical wall (blue)—consistent with rougher downskin surfaces resulting in earlier crack formation. The roughness reduction provided by the REM ISF process (an extreme isotropic surface-finishing technique) is predicted to improve the fatigue performance for both surface angles (Fig. 2, right). However, note a more pronounced performance difference between 45 and 90 deg. (vertical) due to the fatigue model being more sensitive in the lower roughness ranges. We ran this scenario for a 30-micron layer thickness with orientation and position in the build envelope as uniform random variables. Alternative scenarios can be modeled in real time to further optimize performance.
Establishing a Quality-Control Plan
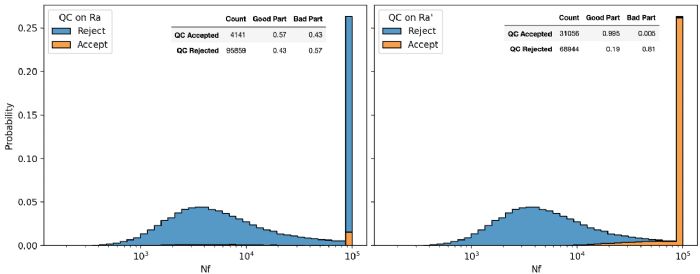 As a second use case of the forward model, we consider the selection of a quality-control plan. Here, we compare two plans designed to ensure a minimum fatigue life of 10,000 cycles at 1-percent maximum strain. In the first strategy, we inspect the as-built samples. This plan can reduce costs by rejecting parts before surface finishing. In the second plan, we inspect the parts in the surface-finished state. Fig. 3 shows two histograms comparing the predicted fatigue life at 1-percent maximum stress for a component finished via the REM ISF process with a 30-micron layer thickness, a 90-deg. surface angle and all other input variables unconstrained.
The first strategy (Fig. 3, left) cannot achieve a useful decision threshold. The 15-micron threshold used to generate the figure produced a 43-percent false-positive rate. Decreasing the threshold further reduces the already low count of accepted parts. This strategy cannot overcome the variability introduced by the surface-finishing process.
The second strategy (Fig. 3, right) provides much better results. Using a roughness threshold of 2.4 microns limits the false-positive rate to 0.5 percent while maintaining a limited false-negative rate.
To further validate this quality-control strategy and link to probability-of-detection concepts, this model can be extended to include the measurement error.
In a hybrid approach, roughness measured in the as-built state could be used to select the most cost-effective surface-finishing approach within predictive performance requirements, with roughness then confirmed in the surface-finished state.
Outcome-Driven Parameter Selection
The Fig. 1 graph, applied in reverse, allows the prediction of process parameters that will achieve a given fatigue requirement. Used this way, the model provides manufacturing requirements for possible use in a technical data package.
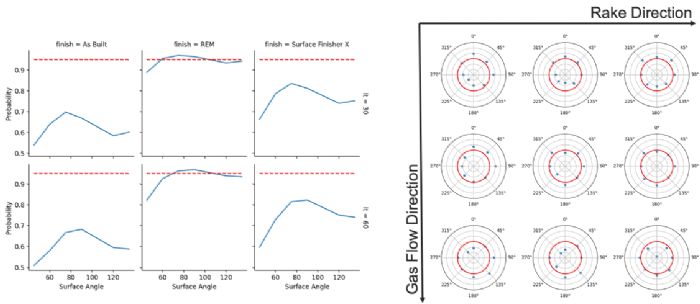 As an example, consider a minimum life requirement of 1000 cycles at 1-percent max strain, 100 cycles at 2-percent max strain and 10 cycles at 3-percent max strain. First evaluate the parameters with the biggest influence: surface-finishing technique, layer thickness and surface angle, while leaving the remaining parameters unconstrained. The selection of surface-finishing process proves critical for achieving a 95-percent probability of success (Fig. 4, left). To further improve the probability of success, we consider the position and orientation of the part for the REM ISF surface-finishing process, a 60-micron layer thickness, and surface angle between 75 and 105 deg. We show results with the build area broken into a 3-by-3 grid (Fig. 4, right), with a polar plot of orientation plotted for each grid location. The red line corresponds to a 96.5-percent probability of success, illustrating that careful selection within the full process window can further improve the probability of success.
Next Steps
EWI is extending these models to include data for the nickel-based alloy IN718, generated by the AMC; surface-texture data generated for the ASTM AM Center of Excellence; and data that include the effect of HIP generated for America Makes under the Advancing AM Post Processing Techniques program. This model can be extended for topics such as process monitoring or powder recycling by including powder chemistry and powder-size distribution. 3DMP
Note: Any reference to specific equipment and/or materials is for informational purposes only. Any reference made to a specific product does not constitute or imply an endorsement by EWI of the product, or its producer or provider.
See also: EWI, Buffalo Manufacturing Works
Technologies:


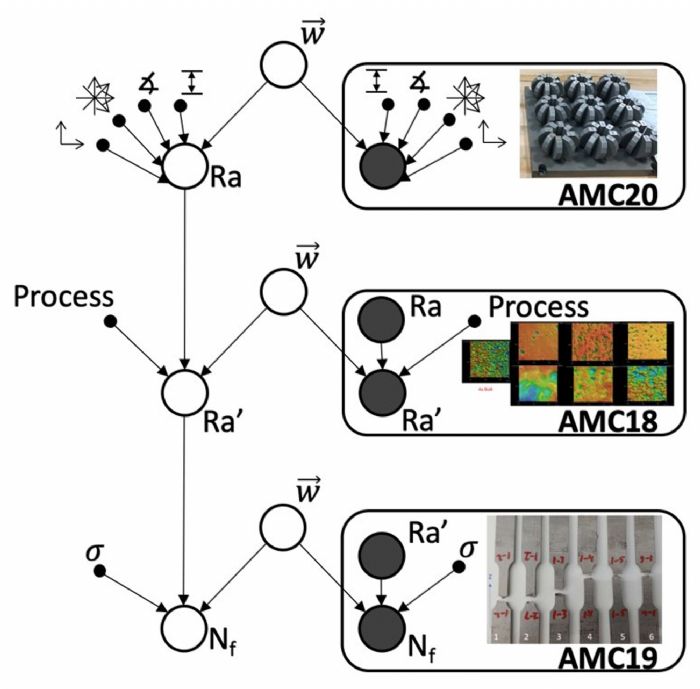 EWI has used this data to train a predictive model for part performance. This model, a generative Bayesian network (Fig. 1), consists of 3D-separable subgraphs trained using Bayesian linear regression. Bayesian networks provide a machine-learning method for forward and backward prediction of causal processes. The model includes the effects of surface angle, orientation of the surface relative to the rake and gas flow, position of the coupon within the build envelope, layer thickness, surface-finishing technique and stress level for fatigue testing. The as-built roughness data come from Ti64 components built using laser powder-bed fusion while the second two datasets result from Ti64 components built using electron beam melting with HIP. We assume transferability given the consistency in materials, but additional data can be used to establish a discrepancy function. In this article we will summarize three usecases for this model.
 Video
Video