n and m Values Are Important When Forming
September 1, 2017Comments
A look back over most of metalforming history shows a dependency on traditional yield-strength, tensile-strength and total-elongation values. To obtain this data, a machined tensile sample is placed between two jaws of a tensile-test machine and the sample is stretched until it breaks. Current test machines use electronic load cells and extensometers to trace out graphs showing stress versus strain. The engineering stress-strain curve shows for each increment of deformation the corresponding stress increase due to workhardening. The traditional graph has four distinct stages: yield strength, uniform elongation, UTS and total elongation. 
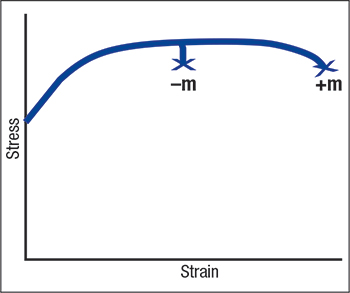
Fig. 1—Standard stress-strain curves allow n values to be obtained.
σ = Kεn
The n value describes the workhardening of the metal or the steepness of the stress-strain curve. The tensile-strength/yield-strength ratio is related to the n value and the uniform elongation. Higher n values create higher engineering stress and strain curves. 

Fig. 2—Higher yield stress will cause major reductions in the n value. Fig. 3—High n values greatly reduce sharp bends.
Nature does not provide something for nothing, as Fig. 2 shows. Techniques to strengthen steel by increasing the yield stress also reduce n values. Coldworking is the worst method to strengthen steel.


