


Enhanced Support for Test System Applications with XY Plotting
November 28, 2017Comments
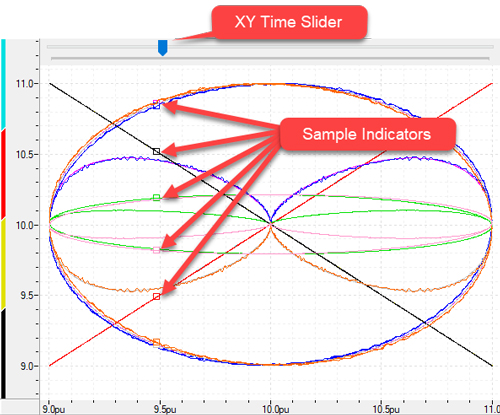
RMCTools motion control software by Delta Computer systems, Battle Ground, WA, now features XY plotting in addition to plotting variables over time. XY plots have value in a number of uses in aiding manufacturing and testing applications. The tool produces stress-strain curves and can be used to compare valve flow versus command signal to check if a valve is within spec. It also can analyze actuator position versus temperature, or be used to characterize hysteresis by observing variation in control variable behavior increases versus decreases. An XY plot displays all the data items in a plot relative to any other data item in the plot, with that other data item being the horizontal (x) axis, and the remaining data items being plotted on the vertical (y) axis. The XY plot feature includes a time slider, which tracks the progression of the plot data over time. This solves the inherent XY plot problem of not being able to tell when any given data point occurred. Additional features include scaling, zooming, cursors for approximating values on the plot, and even switching from XY plotting to time or vice versa.
Delta Computer Systems, Inc.: www.deltamotion.com
Technologies: Bending
Comments
Must be logged in to post a comment. Sign in or Create an Account
There are no comments posted. Bending
Sheet Metal Folding and Forming
Monday, July 7, 2025
 Bending
Cutting, Bending and Welding Equipment Plus Related Software
Monday, August 5, 2024
 Bending
Creative Approaches to Common Press Brake Challenges, Part 1...
Justin Talianek Tuesday, April 30, 2024