
Page 25 - MetalForming January 2015
P. 25
Best Practices
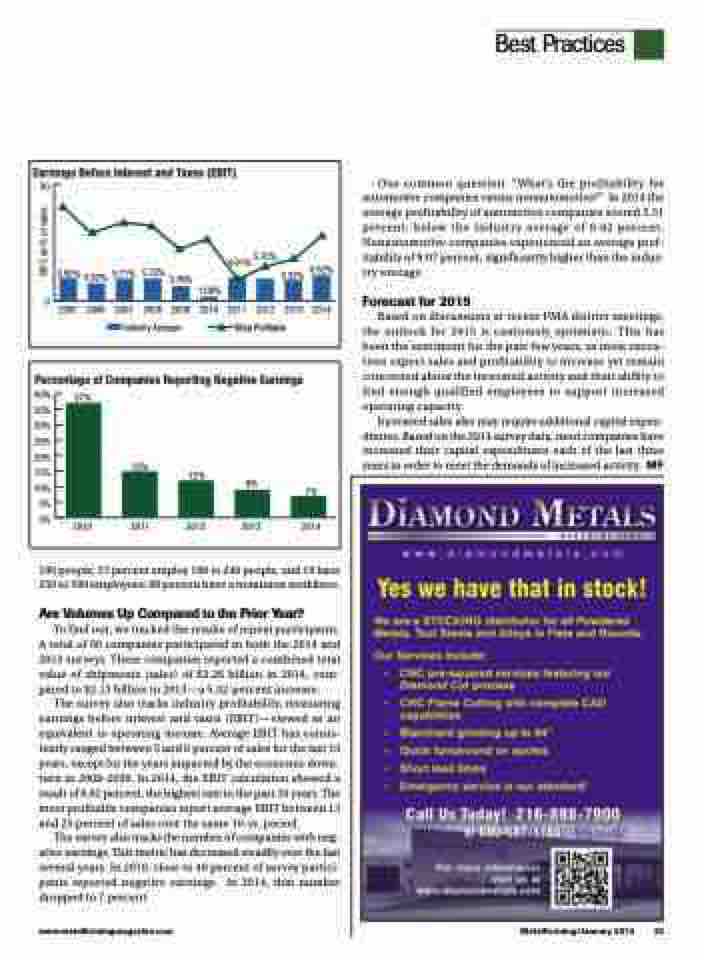
Earnings Before Interest and Taxes (EBIT)
30
0
5.80% 4.52% 5.71% 5.72% 3.78%
1.08%
6.01% 5.72%
5.32% 6.62%
2005 2006 2007 2008 2009 2010 2011 2012 2013 2014
Industry Average Most Profitable
One common question: “What’s the profitability for automotive companies versus nonautomotive?” In 2014 the average profitability of automotive companies scored 5.31 percent, below the industry average of 6.62 percent. Nonautomotive companies experienced an average prof- itability of 9.07 percent, significantly higher than the indus- try average.
Forecast for 2015
Based on discussions at recent PMA district meetings, the outlook for 2015 is cautiously optimistic. This has been the sentiment for the past few years, as most execu- tives expect sales and profitability to increase yet remain concerned about the increased activity and their ability to find enough qualified employees to support increased operating capacity.
Increased sales also may require additional capital expen- ditures. Based on the 2014 survey data, most companies have increased their capital expenditures each of the last three yearsinordertomeetthedemandsofincreasedactivity. MF
Percentage of Companies Reporting Negative Earnings
40% 35% 30% 25% 20% 15% 10%
5% 0%
37%
15%
12%
9%
7% 2010 2011 2012 2013 2014
100 people; 27 percent employ 100 to 249 people, and 19 have 250 to 500 employees; 88 percent have a nonunion workforce.
Are Volumes Up Compared to the Prior Year?
To find out, we tracked the results of repeat participants. A total of 60 companies participated in both the 2014 and 2013 surveys. These companies reported a combined total value of shipments (sales) of $2.26 billion in 2014, com- pared to $2.13 billion in 2013—a 5.32-percent increase.
The survey also tracks industry profitability, measuring earnings before interest and taxes (EBIT)—viewed as an equivalent to operating income. Average EBIT has consis- tently ranged between 5 and 6 percent of sales for the last 10 years, except for the years impacted by the economic down- turn in 2008-2009. In 2014, the EBIT calculation showed a result of 6.62 percent, the highest rate in the past 10 years. The most profitable companies report average EBIT between 13 and 25 percent of sales over the same 10-yr. period.
The survey also tracks the number of companies with neg- ative earnings. This metric has decreased steadily over the last several years. In 2010, close to 40 percent of survey partici- pants reported negative earnings. In 2014, that number dropped to 7 percent.
www.metalformingmagazine.com
MetalForming/January 2015 23
EBIT, as % of sales
