
Page 24 - MetalForming January 2015
P. 24
Best Practices
By Bob Dobrowsky
2014 Benchmarking Survey
Indicates Strong Industry Performance
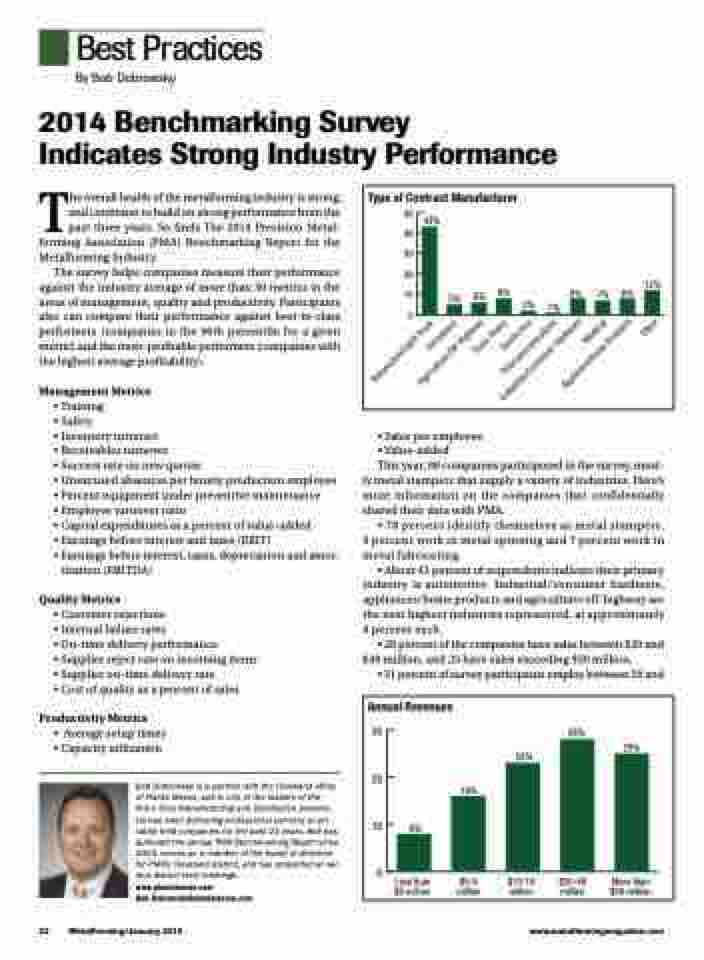
Type of Contract Manufacturer
50
43%
40
30
20
10 5% 6% 8%
0
8% 7% 8%
12%
2%
1%
The overall health of the metalforming industry is strong, and continues to build on strong performance from the past three years. So finds The 2014 Precision Metal- forming Association (PMA) Benchmarking Report for the Metalforming Industry.
The survey helps companies measure their performance against the industry average of more than 50 metrics in the areas of management, quality and productivity. Participants also can compare their performance against best-in-class performers (companies in the 90th percentile for a given metric) and the most-profitable performers (companies with the highest average profitability).
Management Metrics
• Training
• Safety
• Inventory turnover
• Receivables turnover
• Success rate on new quotes
• Unexcused absences per hourly production employee
• Percent equipment under preventive maintenance
• Employee turnover ratio
• Capital expenditures as a percent of value-added
• Earnings before interest and taxes (EBIT)
• Earnings before interest, taxes, depreciation and amor-
tization (EBITDA)
Quality Metrics
• Customer rejections
• Internal failure rates
• On-time delivery performance
• Supplier reject rate on incoming items • Supplier on-time delivery rate
• Cost of quality as a percent of sales
Productivity Metrics
• Average setup times • Capacity utilization
Bob Dobrowsky is a partner with the Cleveland office of Plante Moran, and is one of the leaders of the firm’s Ohio Manufacturing and Distribution practice. He has been delivering professional services to pri- vately held companies for the past 21 years. Bob has authored the annual PMA Benchmarking Report since 2003, serves as a member of the board of directors for PMA’s Cleveland district, and has presented at var- ious district level meetings.
www.plantemoran.com Bob.Dobrowsky@plantemoran.com
• Sales per employee
• Value-added
This year, 88 companies participated in the survey, most-
ly metal stampers that supply a variety of industries. Here’s more information on the companies that confidentially shared their data with PMA:
• 78 percent identify themselves as metal stampers, 9 percent work in metal spinning and 7 percent work in metal fabricating.
• About 43 percent of respondents indicate their primary industry is automotive. Industrial/consumer hardware, appliances/home products and agriculture/off-highway are the next highest industries represented, at approximately 8 percent each.
• 28 percent of the companies have sales between $20 and $49 million, and 25 have sales exceeding $50 million.
• 31 percent of survey participants employ between 50 and
Annual Revenues
30
20
10
0
16%
$5-9 million
23%
$10-19 million
28%
$20-49 million
25%
More than $50 million
8%
Less than $5 million
22
MetalForming/January 2015
www.metalformingmagazine.com
Automotive/Light Truck Aerospace
Agriculture/Off-Highway Truck Heavy
Electronics Telecommunications Industrial/Consumer Hardware
Medical Appliance/Home Products
Other
