
Page 25 - MetalForming December 2009
P. 25
60 × –40 40 × –20 20 × 0 40 × 20 60 × 60 Plane strain Balanced biaxial
Fig. 2—Examples of some combinations of major and minor strains are shown with the minor strain range limited to -40 to +60 percent.
The n-value is the work-hardening exponent discussed in the September and October columns. The equation shows that sheet thickness has a small effect on FLC0, but n-value has a direct relationship.
An interesting feature of the FLC is that the least amount of allowable stretchability occurs when the minor strain is zero. Stretching or compressing the minor strain direction increases the allowable major strain. The FLCs are experimental curves. Worldwide agree- ment on theories behind these curves is still lacking after several decades of press shop applications.
Up to this point, the FLC discussion has considered only low-carbon steels. These steels are one alloy (low-carbon) and one temper (dead soft or light tem- per passed) for different types and grades. There also are FLCs for stainless steel, aluminum, copper, brass and many other metal alloys. Unfortunate- ly, the huge number of alloy, type, grade, thickness, and temper combinations with relatively low-volume production has not made it feasible to conduct extensive studies to obtain a critical mass of data needed to generate equa- tions for FLC0 or even standard shape curves similar to those available for steel. Therefore, these alloys require laboratory generated experimental FLC curves for each batch of material being studied.
Many physical press shops use circle grids and FLCs to determine the sever- ity of their stampings for die tryout, production and troubleshooting. How- ever, the most widely accepted applica- tion of these techniques is found in the virtual press shop or computerized die tryout. Strain combinations over FLC provide a measure of forming severity and a signal for the onset of failure. Corrective actions are implemented with simple strokes of the keyboard instead of the traditional grinding and welding found in almost all physical press shops. MF
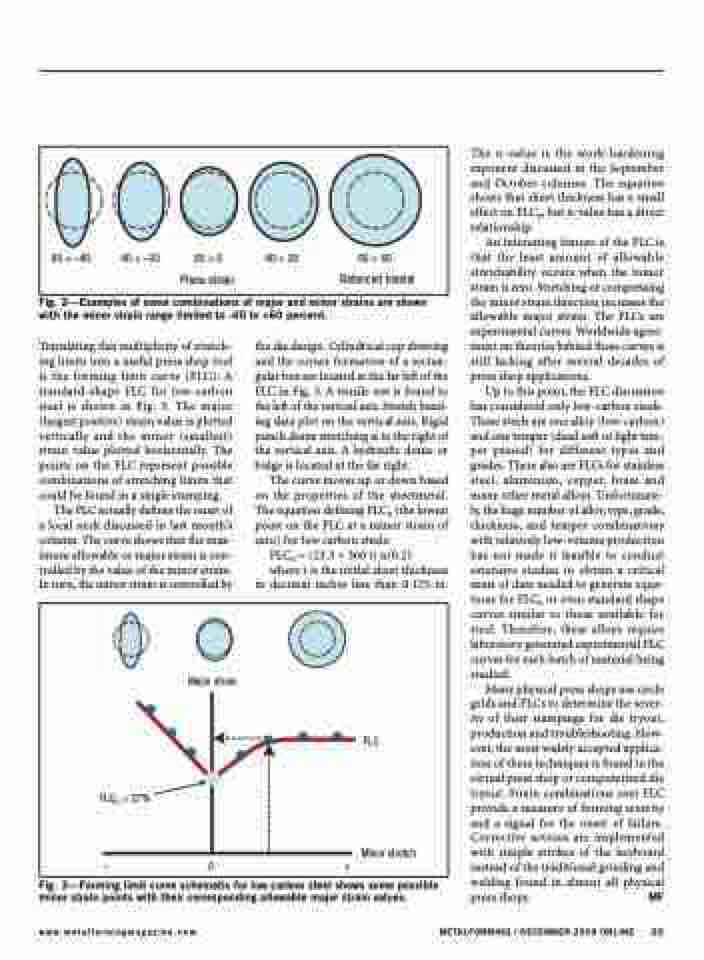
Translating this multiplicity of stretch- ing limits into a useful press shop tool is the forming limit curve (FLC). A standard-shape FLC for low-carbon steel is shown in Fig. 3. The major (largest positive) strain value is plotted vertically and the minor (smallest) strain value plotted horizontally. The points on the FLC represent possible combinations of stretching limits that could be found in a single stamping.
The FLC actually defines the onset of a local neck discussed in last month’s column. The curve shows that the max- imum allowable or major strain is con- trolled by the value of the minor strain. In turn, the minor strain is controlled by
the die design. Cylindrical cup drawing and the corner formation of a rectan- gular box are located at the far left of the FLC in Fig. 3. A tensile test is found to the left of the vertical axis. Stretch bend- ing data plot on the vertical axis. Rigid punch dome stretching is to the right of the vertical axis. A hydraulic dome or bulge is located at the far right.
The curve moves up or down based on the properties of the sheetmetal. The equation defining FLC0 (the lowest point on the FLC at a minor strain of zero) for low carbon steels:
FLC0 = (23.3 + 360 t) n/0.21
where t is the initial sheet thickness in decimal inches less than 0.125-in.
Major strain
FLC0 = 27%
FLC
Minor stretch
–0+
Fig. 3—Forming limit curve schematic for low carbon steel shows some possible minor strain points with their corresponding allowable major strain values.
www.metalformingmagazine.com
METALFORMING / DECEMBER 2009 ONLINE 23
