
Page 46 - MetalForming April 2020
P. 46
Cutting Edge
By Eren Billur, Ph.D.
Digital Image Correlation:
How it Changed the Bulge Test
Fc
Fc
tR
hd
t0
a) Schematic of the beginning of the test
P
rf rc
b) Schematic during the test
In my previous column (February 2020 issue of MetalForming), I stat- ed: “For metal formers, one of the simplest and oldest tests is the tensile test.” This column discusses the bulge test—nearly as old, with the earliest test setups built in the 1910s—digital image correlation (DIC), and the ISO 16808 standard, written in 2014.
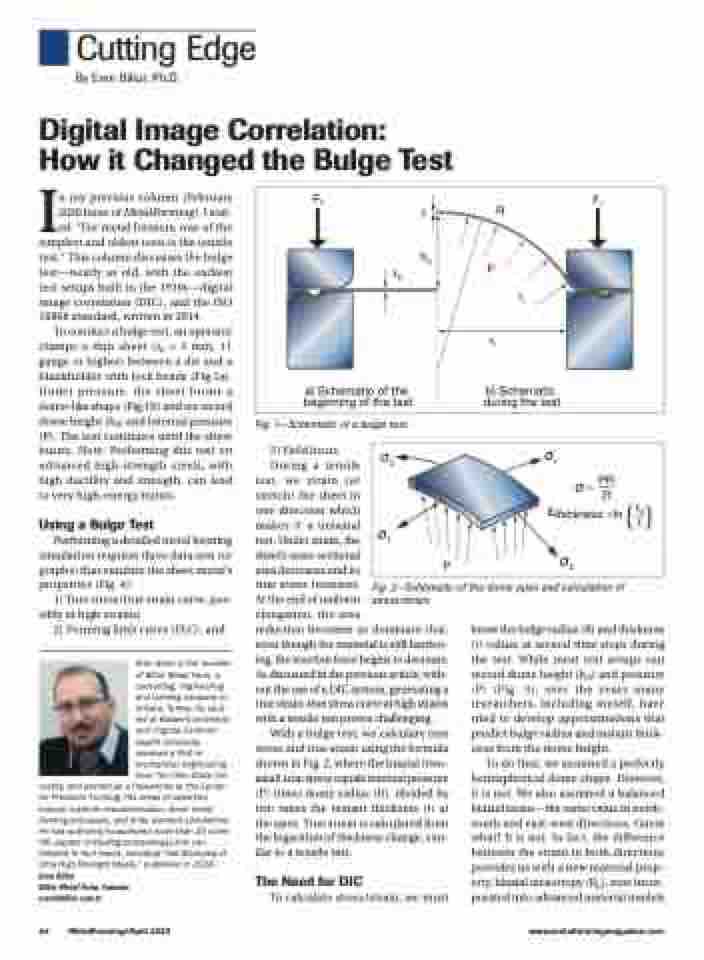
To conduct a bulge test, an operator clamps a thin sheet (t0 < 3 mm, 11 gauge or higher) between a die and a blankholder with lock beads (Fig.1a). Under pressure, the sheet forms a dome-like shape (Fig.1b) and we record dome height (hd) and internal pressure (P). The test continues until the sheet bursts. Note: Performing this test on advanced high-strength steels, with high ductility and strength, can lead to very high-energy bursts.
Using a Bulge Test
Performing a detailed metal forming simulation requires three data sets (or graphs) that emulate the sheet metal’s properties (Fig. 4):
1) True stress/true strain curve, pos- sibly at high strains;
2) Forming limit curve (FLC); and
Eren Billur is the founder of Billur Metal Form, a consulting, engineering and training company in Ankara, Turkey. He stud- ied at Baskent University and Virginia Common- wealth University, received a PhD in mechanical engineering from The Ohio State Uni-
versity, and worked as a researcher at the Center for Precision Forming. His areas of expertise include material characterization, sheet metal forming processes, and finite element simulations. He has authored/co-authored more than 20 scien- tific papers (including proceedings) and con- tributed to four books, including “Hot Stamping of Ultra High Strength Steels,” published in 2018. Eren Billur
Billur Metal Form, Founder eren@billur.com.tr
Fig. 1—Schematic of a bulge test.
3) Yield locus.
During a tensile
test, we strain (or
stretch) the sheet in
one direction which
makes it a uniaxial
test. Under strain, the
sheet’s cross-sectional
area decreases and its
true stress increases.
At the end of uniform
elongation, the area
reduction becomes so dominant that, even though the material is still harden- ing, the reaction force begins to decrease. As discussed in the previous article, with- out the use of a DIC system, generating a true strain-true stress curve at high strains with a tensile test proves challenging.
With a bulge test, we calculate true stress and true strain using the formula shown in Fig. 2, where the biaxial (two- axial) true stress equals internal pressure (P) times dome radius (R), divided by two times the instant thickness (t) at the apex. True strain is calculated from the logarithm of thickness change, sim- ilar to a tensile test.
The Need for DIC
To calculate stress/strain, we must
σ2 σ1
σ= PR
σ1
P σ2
___
2t
ε __0_
t thickness =ln ( t )
Fig. 2—Schematic of the dome apex and calculation of stress/strain.
know the bulge radius (R) and thickness (t) values at several time steps during the test. While most test setups can record dome height (hd) and pressure (P) (Fig. 3), over the years many researchers, including myself, have tried to develop approximations that predict bulge radius and instant thick- ness from the dome height.
To do that, we assumed a perfectly hemispherical dome shape. However, it is not. We also assumed a balanced biaxial strain—the same value in north- south and east-west directions. Guess what? It is not. In fact, the difference between the strain in both directions provides us with a new material prop- erty, biaxial anisotropy (R ), now incor-
44 MetalForming/April 2020
www.metalformingmagazine.com
b
porated into advanced material models
