
Page 65 - MetalForming September 2015
P. 65
into their favorite averag- ing equation. Since strain gradients are common on both sides of a high-strain or tear location, strain meas- urements on either side are not valid FLC numbers.
3) Initially, a tactile (fin-
ger) evaluation of the sur-
face was performed to
determine whether a neck
had started to form. Many
yes/no arguments ensued
until all of the evaluators
reached a unanimous deci-
sion. Today, many shops
will use a recording camera
focused on the circle and
over the failure location. During normal deformation, a rather shallow line will represent the rate of strain. At the moment the local neck starts to deform, the strain localizes and strain rate immediately increases. That rate-shift point is the FLC. While this setup is rather simple for hemispherical dome testing, it can be complex in a press environment.
4) For low-carbon steels, a standard shape of the FLC has been used for decades (Fig. 2). This curve moves up and down on a major/minor strain graph depending on the value of FLC0—the low point located on the zero minor-strain axis.
FLC0 = (23.3 + 360t-in.) n/0.21
Two steel properties are needed. First is the sheet thick- ness. While not a major effect on FLC0, it does compensate for hot-rolled versus cold-rolled steel thickness differences. The second property is the work-hardening exponent (n- value) which has a direct major relationship with FLC0.
5) Press shops often complain that the FLC is complete- ly wrong when predicting the stretchability of blanked or sheared edges. Actually, the FLC provides the correct answer when inserting the correct n-value into the above equation. The n-value for the incoming steel is not the n-value for a location that underwent severe cold working during edge cut- ting. A study performed on hole expansion showed that a milled or waterjet-cut edge stretched 280 percent. The same steel with a standard sheared edge would only stretch 80 per- cent. These two hole expansions have very different n-values that must be inserted into the FLC0 equation.
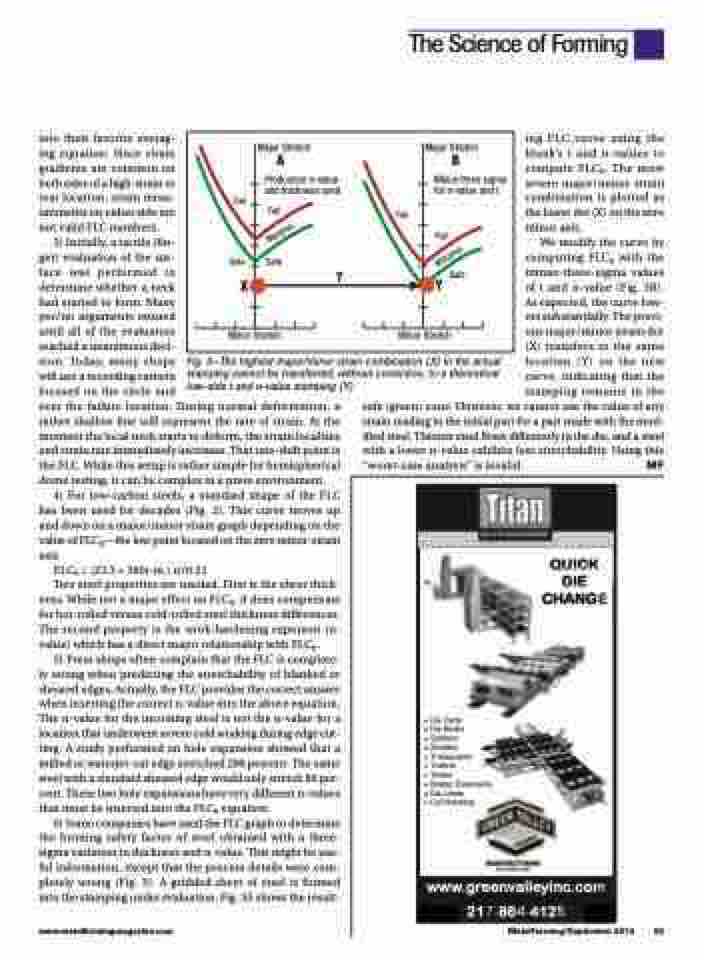
6) Some companies have used the FLC graph to determine the forming safety factor of steel obtained with a three- sigma variation in thickness and n-value. This might be use- ful information, except that the process details were com- pletely wrong (Fig. 3). A gridded sheet of steel is formed into the stamping under evaluation. Fig. 3A shows the result-
ing FLC curve using the blank’s t and n-values to compute FLC0. The most severe major/minor strain combination is plotted as the lower dot (X) on the zero minor axis.
We modify the curve by computing FLC0 with the minus-three-sigma values of t and n-value (Fig. 3B). As expected, the curve low- ers substantially. The previ- ous major/minor strain dot (X) transfers to the same location ( Y ) on the new curve, indicating that the stamping remains in the
safe (green) zone. However, we cannot use the value of any strain reading in the initial part for a part made with the mod- ified steel. Thinner steel flows differently in the die, and a steel with a lower n-value exhibits less stretchability. Using this “worst-case analysis” is invalid. MF
Fig. 3—The highest major/minor strain combination (X) in the actual stamping cannot be transferred, without correction, to a theoretical low-side t and n-value stamping (Y).
The Science of Forming
Major Stretch Major Stretch
AB
Production n-value and thickness used
Fail
Fail
Safe Safe
Minus three sigma for n-value and t
Fail
Fail
? XY
Safe
Minor Stretch Minor Stretch
QUICK
D
D
I
I
E
E
CHANGE
E
� ��� ����� � ��� ����� � ���������
� ��������
� ������������
� ��������
� ������
� ������� ���������� � ��� �������
� ���� ��������
www.greenvalleyinc.com
217
7-86
6
6
4
4
4-4125
www.metalformingmagazine.com
MetalForming/September 2015 63
Marginal
Marginal
