
Page 64 - MetalForming September 2015
P. 64
The Science of Forming
By Stuart Keeler
How Not To Use the Forming Limit Curve
The first research
paper on the form-
ing-limit curve
(FLC), presented at the
1965 International Con-
gress of the Society of
Automotive Engineers
(SAE), described the right
half of the new, unique
curve. Laboratory analysis
had determined the onset
of failure for several steels
by stretching various-
width test strips over hemispherical punches. Stretching continued until the onset of a local (through-thickness) neck (Fig. 1, line A). Researchers plotted, on graph paper, major and minor strains measured over each incipient neck to define the failure limit. The resulting research paper showed datapoints taken from an automotive stamping with a forming failure, and from laboratory tests of the same type of steel having the same FLC. Three years later, additional research generated the left side of the FLC.
Fast forward 50 years, and research continues in search of a standard operating procedure for applying the FLC accept- ed by all companies around the world. Two of the major FLC applications that provide information on the press-shop floor:
• Certifying that a stamping has the required safety mar- gin and/or troubleshooting a formability problem; and
• Virtual forming, or computerized die tryout, where stamping and die design, product improvement and other analyses are conducted by computer analysis. Here the FLC helps to determine forming failure limits and safety margins.
Unfortunately, misuse of the FLC concept and operating procedures can cause operational problems. Here we discuss six such problems.
Stuart Keeler (Keeler Technologies LLC) is known worldwide for his discovery of forming limit diagrams, development of circle-grid analysis and implementa- tion of other press-shop analysis tools. Keeler’s metal- forming experience includes 24 years at National Steel Corporation and 12 years at The Budd Company Technical Center, enabling him to bring a very diverse background to this column and to the seminars he teaches for PMA.
Keeler Technologies LLC
P.O. Box 283 | Grosse Ile, MI 48138 keeltech@comcast.net
1) Measuring the strain values on a well-devel- oped neck (Fig. 1, B). The FLC is defined as the onset of the local neck, which causes deformation throughout the stamping to stop while the neck con- tinues to grow toward frac- ture. Measurements taken over an obvious neck will create an excessively high FLC. Before recognizing
this problem, FLCs created by various people testing the same batch of steel created a wide band of FLC values that were not useful. This problem still exists.
2) Measuring strain values on each side of a torn specimen (Fig. 1, C). A tear of the local neck will cause open gaps in the steel that will vary depending on how quickly the deforma- tion was stopped. To obtain strain values for this problem, researchers took measurements of the major strain from stretched circles on each side of the tear and plugged them
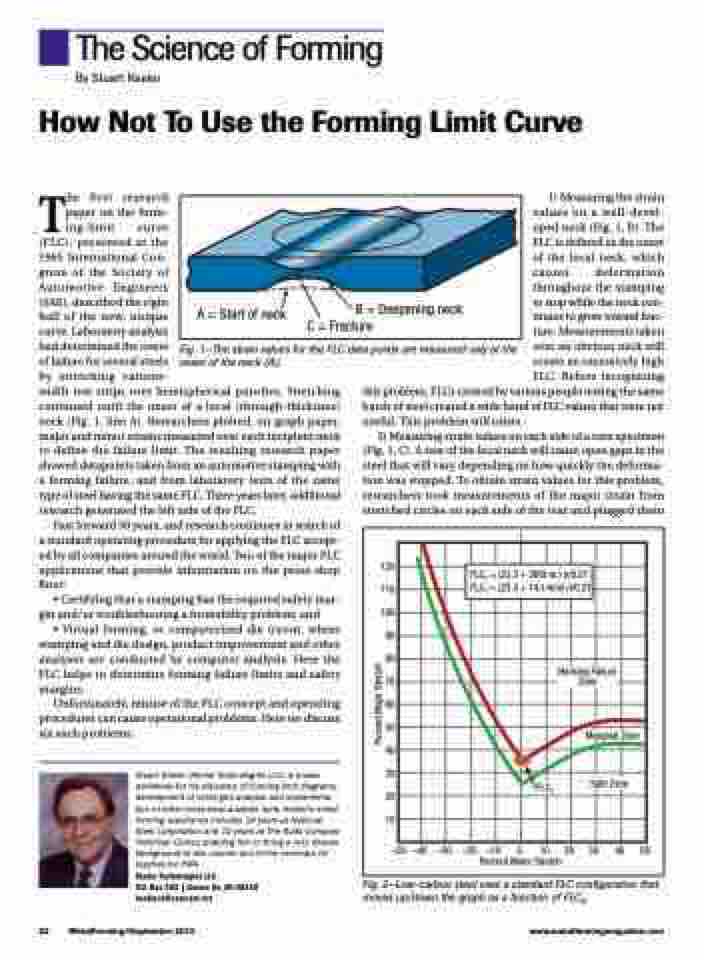
A = Start of neck
B = Deepening neck C = Fracture
Fig. 1—The strain values for the FLC data points are measured only at the onset of the neck (A).
120 110 100
90 80 70 60 50 40 30 20 10
–50 –40 –30 –20 –10
Percent Minor Stretch
40 50
FLC0 = (23.3 + 360t-in.) n/0.21 FLC0 = (23.3 + 14.t-mm) n/0.21
Necking Failure Zone
Marginal Zone
0 10 20 30
Safe Zone
FLC0
62 MetalForming/September 2015
www.metalformingmagazine.com
Fig. 2—Low-carbon steel uses a standard FLC configuration that moves up/down the graph as a function of FLC0.
Percent Major Stretch
