
Page 38 - MetalForming July 2015
P. 38
The Science of Forming
By Stuart Keeler
Stress-Strain Curves Give Visual Clues About Formability
You need a quick formability comparison for five differ- ent metal alloys. The five tensile tests have just been completed and the engineering stress-strain curves are available, but not the numerical data. You must make a judgement about the n-value, m-value, forming-limit curve (FLC) and total elongation using the shape of the curve.
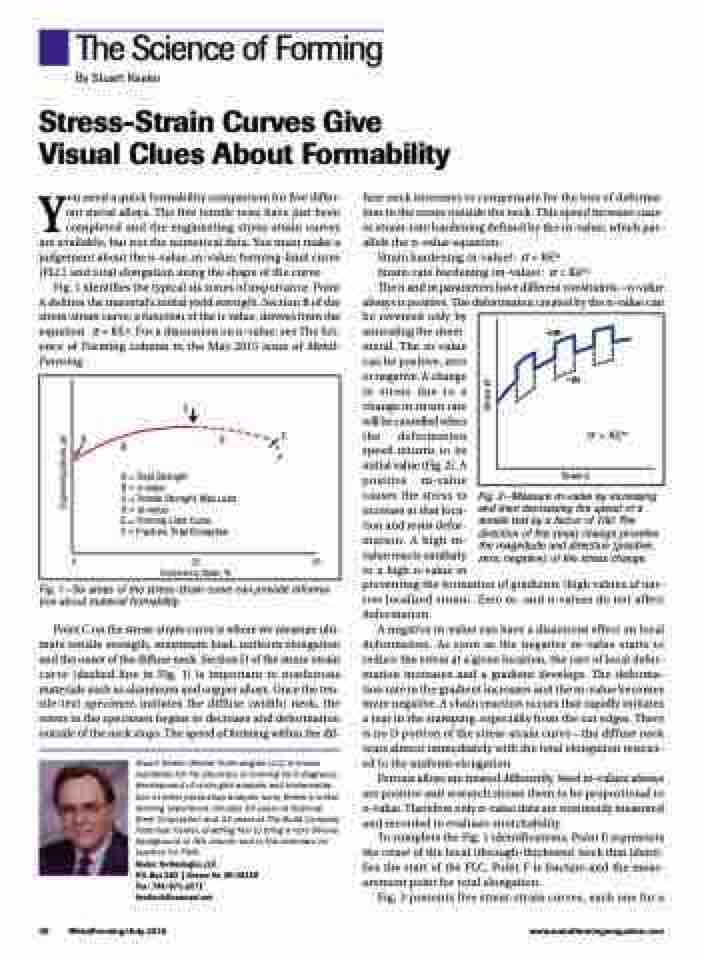
fuse neck increases to compensate for the loss of deforma- tion in the zones outside the neck. This speed increase caus- es strain-rate hardening defined by the m-value, which par- allels the n-value equation:
n
m
always is positive. The deformation created by the n-value can be reversed only by
annealing the sheet-
metal. The m-value
Fig. 1 identifies the typical six zones of importance. Point A defines the material’s initial yield strength. Section B of the stress-strain curve, a function of the n-value, derives from the
Strain hardening (n-value): σ = KЄ
Strain-rate hardening (m-value): σ = Kέ
The n and m parameters have different constraints—n-value
n
equation σ = KЄ . For a discussion on n-value, see The Sci-
+m
–m
σ=Κεm Strain ε
ence of Forming column in the May 2015 issue of Metal- Forming.
can be positive, zero
or negative. A change
in stress due to a
change in strain rate
will be cancelled when
the deformation
speed returns to its
initial value (Fig. 2). A
positive m-value
causes the stress to
increase at that loca-
tion and resist defor-
mation. A high m-
value reacts similarly
to a high n-value in
preventing the formation of gradients (high values of nar- row localized strain). Zero m- and n-values do not affect deformation.
A negative m-value can have a disastrous effect on local deformation. As soon as the negative m-value starts to reduce the stress at a given location, the rate of local defor- mation increases and a gradient develops. The deforma- tion rate in the gradient increases and the m-value becomes more negative. A chain reaction occurs that rapidly initiates a tear in the stamping, especially from the cut edges. There is no D portion of the stress-strain curve—the diffuse neck tears almost immediately with the total elongation restrict- ed to the uniform elongation.
Ferrous alloys are treated differently. Steel m-values always are positive and research shows them to be proportional to n-value. Therefore only n-value data are commonly measured and recorded to evaluate stretchability.
To complete the Fig. 1 identifications, Point E represents the onset of the local (through-thickness) neck that identi- fies the start of the FLC. Point F is fracture and the meas- urement point for total elongation.
Fig. 3 presents five stress-strain curves, each one for a
A
B
C
D
E F
A = Yield Strength
B = n-value
C = Tensile Strenght, Max Load
D = m-value
E = Forming Limit Curve
F = Fracture, Total Elongation
0 25 50 Engineering Strain, %
Fig. 1—Six areas of the stress-strain curve can provide informa- tion about material formability.
Point C on the stress-strain curve is where we measure ulti- mate tensile strength, maximum load, uniform elongation and the onset of the diffuse neck. Section D of the stress-strain curve (dashed line in Fig. 1) is important to nonferrous materials such as aluminum and copper alloys. Once the ten- sile-test specimen initiates the diffuse (width) neck, the stress in the specimen begins to decrease and deformation outside of the neck stops. The speed of forming within the dif-
Stuart Keeler (Keeler Technologies LLC) is known worldwide for his discovery of forming limit diagrams, development of circle-grid analysis and implementa- tion of other press-shop analysis tools. Keeler’s metal- forming experience includes 24 years at National Steel Corporation and 12 years at The Budd Company Technical Center, enabling him to bring a very diverse background to this column and to the seminars he teaches for PMA.
Keeler Technologies LLC
P.O. Box 283 | Grosse Ile, MI 48138 Fax: 734/671-2271 keeltech@comcast.net
Fig. 2—Measure m-value by increasing and then decreasing the speed of a tensile test by a factor of 100. The direction of the stress change provides the magnitude and direction (positive, zero, negative) of the stress change.
36 MetalForming/July 2015
www.metalformingmagazine.com
Engineering Stress, psi
Stress σ
