
Page 52 - MetalForming May 2014
P. 52
The Science of Forming By Stuart Keeler
True AHSS Stress-Strain Curves
UTS
YS
Stress at 10% strain (“n” value calculation)
Yield strength
Uniform elongation
Total elongation
eTS Engineering Strain (%)
Fracture
Instability region
Ultimate tensile strength
e10
The article on advanced high- strength steels (AHSS) in this month’s issue reviews new AHSS technology developed during the last five years. Increased emphasis is placed on mechanical and other properties that define what the steels can and cannot do during forming, as well as in- service performance. Knowledge about each steel type and grade allows users to match the steel to the needs of the final stamping.
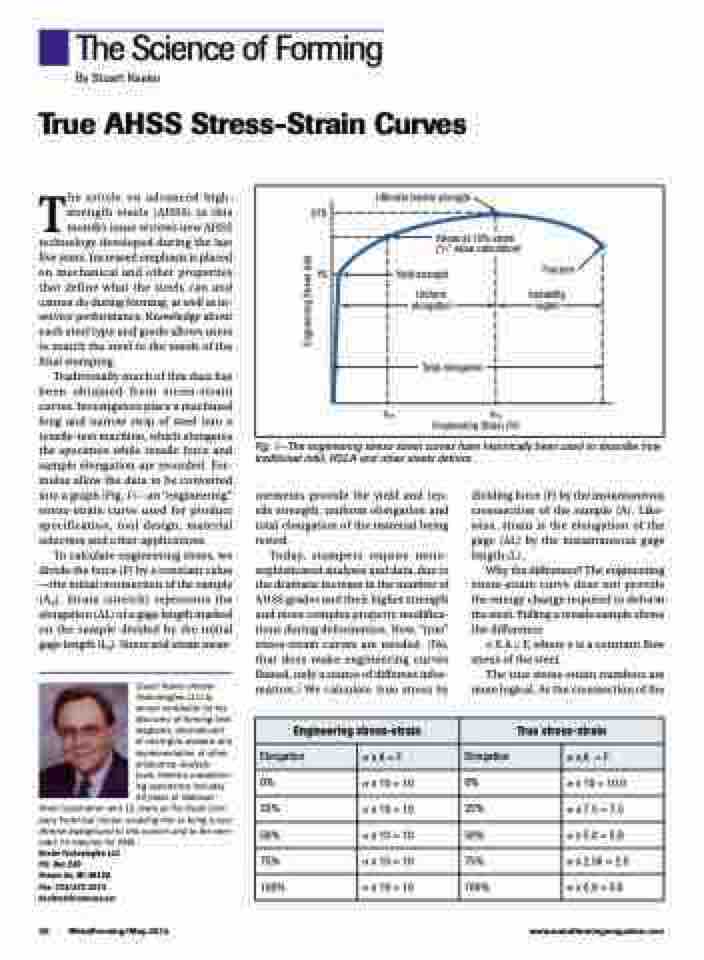
Traditionally much of this data has been obtained from stress-strain curves. Investigators place a machined long and narrow strip of steel into a tensile-test machine, which elongates the specimen while tensile force and sample elongation are recorded. For- mulas allow the data to be converted into a graph (Fig. 1)—an “engineering” stress-strain curve used for product specification, tool design, material selection and other applications.
To calculate engineering stress, we
divide the force (F) by a constant value
—the initial crosssection of the sample
Stuart Keeler (Keeler Technologies LLC) is known worldwide for his discovery of forming limit diagrams, development of circle-grid analysis and implementation of other press-shop analysis
tools. Keeler’s metalform- ing experience includes 24 years at National
Steel Corporation and 12 years at The Budd Com- pany Technical Center, enabling him to bring a very diverse background to this column and to the sem- inars he teaches for PMA.
Keeler Technologies LLC P.O. Box 283
Grosse Ile, MI 48138 Fax: 734/671-2271 keeltech@comcast.net
Fig. 1—The engineering stress-strain curves have historically been used to describe how traditional mild, HSLA and other steels deform.
(A ). Strain (stretch) represents the 0
Why the difference? The engineering stress-strain curve does not provide the energy change required to deform the steel. Pulling a tensile sample shows the difference:
elongation (∆L) of a gage length marked on the sample divided by the initial gage length (L0). Stress and strain meas-
σ X A = F, where σ is a constant flow stress of the steel.
urements provide the yield and ten- sile strength, uniform elongation and total elongation of the material being tested.
Today, stampers require more- sophisticated analyses and data, due to the dramatic increase in the number of AHSS grades and their higher strength and more complex property modifica- tions during deformation. Now, “true” stress-strain curves are needed. (No, that does make engineering curves flawed, only a source of different infor- mation.) We calculate true stress by
dividing force (F) by the instantaneous crosssection of the sample (A). Like- wise, strain is the elongation of the gage (∆L) by the instantaneous gage length (L).
The true stress-strain numbers are more logical. As the crosssection of the
Engineering stress-strain
True stress-strain
Elongation
xA=F
Elongation
xA =F
0%
x 10 = 10
0%
x 10 = 10.0
25%
x 10 = 10
25%
x 7.5 = 7.5
50%
x 10 = 10
50%
x 5.0 = 5.0
75%
x 10 = 10
75%
x 2.50 = 2.5
100%
x 10 = 10
100%
x 0.0 = 0.0
50 MetalForming/May 2014
www.metalformingmagazine.com
Engineering Stress (ksi)
