
Page 72 - MetalForming October 2013
P. 72
The Science of Forming
By Stuart Keeler
Old and New Ways to Solve Forming Challenges
Predicting the distribution of stretch within a stamped part has been a challenge since the early days of dies and presses. The stamping tears when the design requires exces- sive stretch. Buckles and floppy areas result from insufficient stretch.
Modifying one area of stretch can cause an unexpected reaction through- out the entire stamping. Numerous procedures have been developed in an attempt to quantify stretch levels prior to cutting the hard tool. They range from ink-gridded rubber sheets pulled over a wooden model of the stamping to calculating percent stretch for each section line in the blueprint. While pro- viding some measure of qualitative information, the results depend high- ly on the interpretation—and bias—of the evaluator.
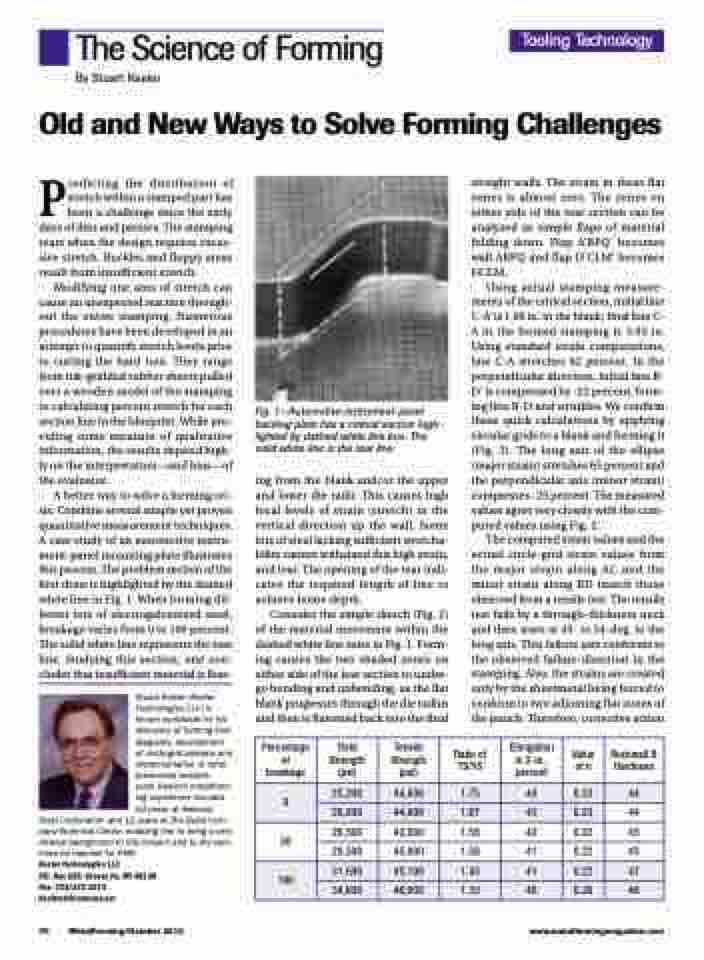
A better way to solve a forming cri- sis: Combine several simple yet proven quantitative measurement techniques. A case study of an automotive instru- ment-panel mounting plate illustrates this process. The problem section of the first draw is highlighted by the dashed white line in Fig. 1. When forming dif- ferent lots of electrogalvanized steel, breakage varies from 0 to 100 percent. The solid white line represents the tear line. Studying this section, one con- cludes that insufficient material is flow-
Stuart Keeler (Keeler Technologies LLC) is known worldwide for his discovery of forming limit diagrams, development of circle-grid analysis and implementation of other press-shop analysis
tools. Keeler’s metalform- ing experience includes 24 years at National
Steel Corporation and 12 years at The Budd Com- pany Technical Center, enabling him to bring a very diverse background to this column and to the sem- inars he teaches for PMA.
Keeler Technologies LLC
P.O. Box 283, Grosse Ile, MI 48138 Fax: 734/671-2271 keeltech@comcast.net
Fig. 1—Automotive instrument-panel backing plate has a critical section high- lighted by dashed white line box. The solid white line is the tear line.
ing from the blank and/or the upper and lower die radii. This causes high local levels of strain (stretch) in the vertical direction up the wall. Some lots of steel lacking sufficient stretcha- bility cannot withstand this high strain, and tear. The opening of the tear indi- cates the required length of line to achieve home depth.
Consider the simple sketch (Fig. 2) of the material movement within the dashed white line zone in Fig. 1. Form- ing causes the two shaded zones on either side of the tear section to under- go bending and unbending, as the flat blank progresses through the die radius and then is flattened back into the final
straight walls. The strain in these flat zones is almost zero. The zones on either side of the tear section can be analyzed as simple flaps of material folding down. Flap A’BPQ’ becomes wall ABPQ and flap D’CLM’ becomes DCLM.
Using actual stamping measure- ments of the critical section, initial line C-A’ is 1.88 in. in the blank; final line C- A in the formed stamping is 3.05 in. Using standard strain computations, line C-A stretches 62 percent. In the perpendicular direction, initial line B- D’ is compressed by -22 percent, form- ing line B-D and wrinkles. We confirm these quick calculations by applying circular grids to a blank and forming it (Fig. 3). The long axis of the ellipse (major strain) stretches 65 percent and the perpendicular axis (minor strain) compresses -25 percent. The measured values agree very closely with the com- puted values using Fig. 2.
The computed strain values and the actual circle-grid strain values from the major strain along AC and the minor strain along BD match those observed from a tensile test. The tensile test fails by a through-thickness neck and then tears at 45- to 54-deg. to the long axis. This failure axis conforms to the observed failure direction in the stamping. Also, the strains are created only by the sheetmetal being forced to conform to two adjoining flat zones of the punch. Therefore, corrective action
Tooling Technology
Percentage of breakage
Yield Strength (psi)
Tensile Strength (psi)
Ratio of TS/YS
Elongation in 2-in., percent
Value of n
Rockwell B Hardness
0
25,200
44,500
1.75
44
0.23
44
26,800
44,800
1.67
43
0.23
44
50
26,500
42,000
1.58
42
0.22
43
28,500
45,000
1.58
41
0.22
43
100
31,500
45,100
1.43
41
0.22
47
34,600
46,000
1.33
40
0.20
48
70 MetalForming/October 2013
www.metalformingmagazine.com
