
Page 50 - MetalForming September 2013
P. 50
The Science of Forming By Stuart Keeler
Tooling Technology
Opt for Qualitative, Rather Than Quantitative, Analysis of Steel Data
B
TS=600MPa TS=525MPa
A
Engineering Strain
YS=350MPa
Computers, electronic measuring devices, video recorders and other technological advance- ments entering our pressrooms often hinder our understanding of the met- alforming processes. While mathe- matically correct, the massive amount of data spewing from these machines often is confusing, misinterpreted, overly time consuming and not use- ful. When it comes to comparing dif- ferent types and grades of steel, often qualitative analyses of simple data will provide sufficient information.
Assume a tensile-test machine reports the n-values (workhardening exponent) of steel A as 0.213849 and steel B as 0.213122. The larger n-value (steel A) generally means more stretch- ability. For decades, n-value only was valid to two decimal places, but within the last 20 years the third decimal place has gained creditability—when meas- ured under strict test procedures. Just because the computer is programmed to calculate and print three additional decimal places does not mean they contain more useful information. In our example, steels A and B have the same n-value (0.213), typical of an alu- minum-killed deep-draw steel.
Stuart Keeler (Keeler Technologies LLC) is known worldwide for his discovery of forming limit diagrams, development of circle-grid analysis and implementation of other press-shop analysis
tools. Keeler’s metalform- ing experience includes 24 years at National
Steel Corporation and 12 years at The Budd Com- pany Technical Center, enabling him to bring a very diverse background to this column and to the sem- inars he teaches for PMA.
Keeler Technologies LLC P.O. Box 283
Grosse Ile, MI 48138 Fax: 734/671-2271 keeltech@comcast.net
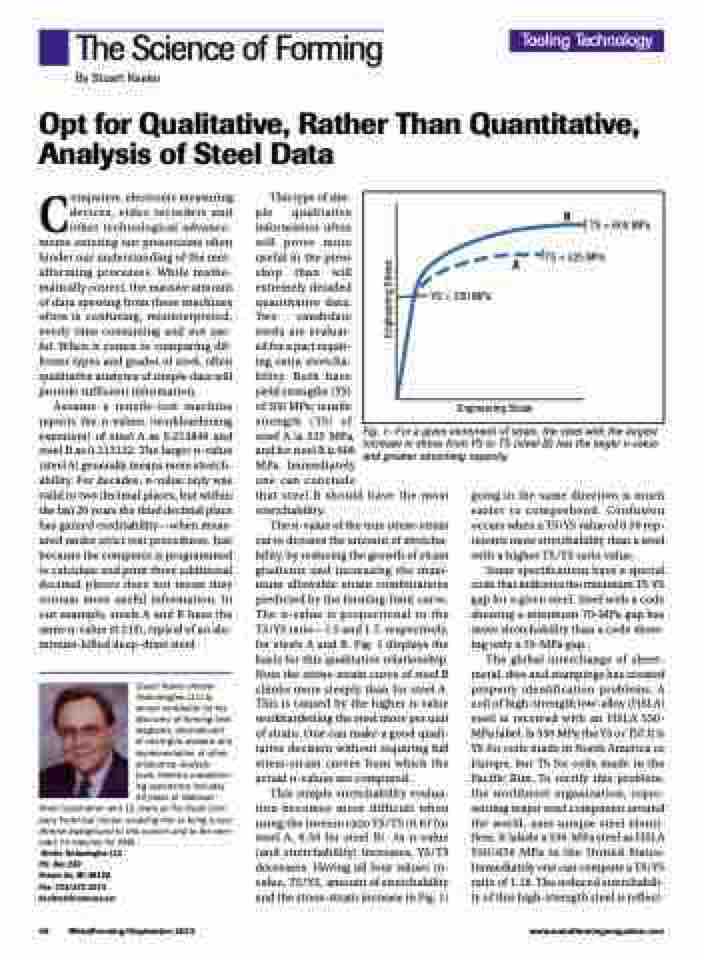
This type of sim- ple qualitative information often will prove more useful in the press shop than will extremely detailed quantitative data. Two candidate steels are evaluat- ed for a part requir- ing extra stretcha- bility. Both have yield strengths ( YS) of 350 MPa; tensile
strength ( TS) of
steel A is 525 MPa, Fig. 1—For a given increment of strain, the steel with the largest and for steel B is 600 increase in stress from YS to TS (steel B) has the larger n-value
and greater stretching capacity.
MPa. Immediately
one can conclude
that steel B should have the most stretchability.
The n-value of the true stress-strain curve dictates the amount of stretcha- bility, by reducing the growth of strain gradients and increasing the maxi- mum allowable strain combinations predicted by the forming-limit curve. The n-value is proportional to the TS/YS ratio—1.5 and 1.7, respectively, for steels A and B. Fig. 1 displays the basis for this qualitative relationship. Note the stress-strain curve of steel B climbs more steeply than for steel A. This is caused by the higher n-value workhardening the steel more per unit of strain. One can make a good quali- tative decision without requiring full stress-strain curves from which the actual n-values are computed.
This simple stretchability evalua- tion becomes more difficult when using the inverse ratio YS/TS (0.67 for steel A, 0.59 for steel B). As n-value (and stretchability) increases, YS/TS decreases. Having all four values (n- value, TS/YS, amount of stretchability and the stress-strain increase in Fig. 1)
going in the same direction is much easier to comprehend. Confusion occurs when a TS/YS value of 0.59 rep- resents more stretchability than a steel with a higher TS/YS ratio value.
Some specifications have a special code that indicates the minimum TS-YS gap for a given steel. Steel with a code showing a minimum 70-MPa gap has more stretchability than a code show- ing only a 35-MPa gap.
The global interchange of sheet- metal, dies and stampings has created property identification problems. A coil of high-strength low-alloy (HSLA) steel is received with an HSLA 550- MPa label. Is 550 MPa the YS or TS? It is YS for coils made in North America or Europe, but TS for coils made in the Pacific Rim. To rectify this problem, the worldsteel organization, repre- senting major steel companies around the world, uses unique steel identi- fiers. It labels a 550-MPa steel as HSLA 550/650 MPa in the United States. Immediately one can compute a TS/YS ratio of 1.18. The reduced stretchabili- ty of this high-strength steel is reflect-
48 MetalForming/September 2013
www.metalformingmagazine.com
Engineering Stress
