
Page 43 - MetalForming June 2012
P. 43
The Science of Forming
A
Production Steel
Production Steel
Reference Steel
Time
B
Reference Steel
Time
control chart from Level 1 (right side of Fig. 2). The stamping analyzed in Fig. 2 shows two excursions into the red (fail- ure) zone and one to the top of the yel- low (safety-margin) zone. The data not only confirm failure events but also the time periods during which unfavorable variables affected the stamping process.
Level 3—Material versus Process Variability
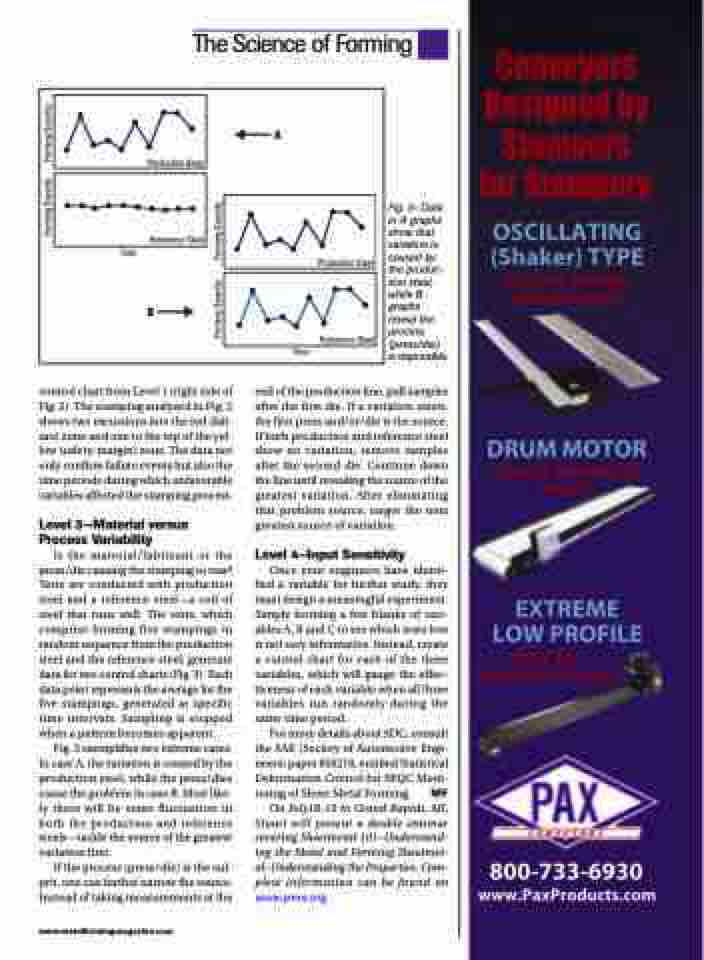
Is the material/lubricant or the press/die causing the stamping to tear? Tests are conducted with production steel and a reference steel—a coil of steel that runs well. The tests, which comprise forming five stampings in random sequence from the production steel and the reference steel, generate data for two control charts (Fig. 3). Each data point represents the average for the five stampings, generated at specific time intervals. Sampling is stopped when a pattern becomes apparent.
Fig. 3 exemplifies two extreme cases. In case A, the variation is created by the production steel, while the press/dies cause the problem in case B. Most like- ly there will be some fluctuation in both the production and reference steels—tackle the source of the greatest variation first.
If the process (press/die) is the cul- prit, one can further narrow the source. Instead of taking measurements at the
Fig. 3—Data in A graphs show that variation is caused by the produc- tion steel, while B graphs reveal the process (press/die) is responsible.
end of the production line, pull samples after the first die. If a variation exists, the first press and/or/die is the source. If both production and reference steel show no variation, remove samples after the second die. Continue down the line until revealing the source of the greatest variation. After eliminating that problem source, target the next greatest source of variation.
Level 4–Input Sensitivity
Once your engineers have identi- fied a variable for further study, they must design a meaningful experiment. Simply forming a few blanks of vari- ables A, B and C to see which tears less is not very informative. Instead, create a control chart for each of the three variables, which will gauge the effec- tiveness of each variable when all three variables run randomly during the same time period.
For more details about SDC, consult the SAE (Society of Automotive Engi- neers) paper 850278, entitled Statistical Deformation Control for SPQC Moni- toring of Sheet Metal Forming. MF
On July18-19 in Grand Rapids, MI, Stuart will present a double seminar covering Sheetmetal 101–Understand- ing the Metal and Forming Sheetmet- al–Understanding the Properties. Com- plete information can be found on www.pma.org.
www.metalformingmagazine.com
Forming Severity Forming Severity
Forming Severity Forming Severity
