
Page 42 - MetalForming June 2012
P. 42
The Science of Forming By Stuart Keeler
Use Statistical Deformation Control to Overcome Forming Problems
Tooling Technology
B
A
Do tears appear and disappear ran- domly in your stampings? Have you tried the typical solutions— brainstorming, grinding/welding, etc.— every trick in the book, with zero suc- cess in making the tears disappear?
Almost every press shop has expe- rienced this frustrating problem. Attacking it by measuring, tracking and controlling the 40 or more forming- input variables is not feasible. Even worse, difficult forming problems usu- ally involve a synergistic interaction of two or more input variables. Conduct- ing a 40-variable full-factorial Design of Experiments (DOE) to determine these interactions is unrealistic.
Instead, the output of the forming system—the final stamping—can be interrogated for data containing root- cause information. One interrogation technique—Statistical Deformation Control (SDC)—provides four levels of data acquisition based on standard sta- tistical-process control charts known to most press shops. Each level further narrows the search for the root cause.
SDC is defined as a press-shop analy- sis technique to monitor forming sever- ity over an extended time period, using an ultrasonic thickness (UT ) gauge to quantitatively define the amount of deformation. It finds use for standard
Stuart Keeler (Keeler Technologies LLC) is known worldwide for his discovery of forming limit diagrams, development of circle-grid analysis and implementation of other press-shop analysis tools. Keeler’s metalform- ing experience includes 24 years at National
Steel Corporation and 12 years at The Budd Com- pany Technical Center, enabling him to bring a very diverse background to this column and to the sem- inars he teaches for PMA.
Keeler Technologies LLC
P.O. Box 283, Grosse Ile, MI 48138
Fax: 734/671-2271, keeltech@comcast.net
control-chart plotting and traditional SPC analysis techniques. Among its benefits:
• Simple, quick thick- ness measurements
• Measurements do not damage stampings
• Stampings can be selected at random
• Uses standard con- trol charts, calibrated with
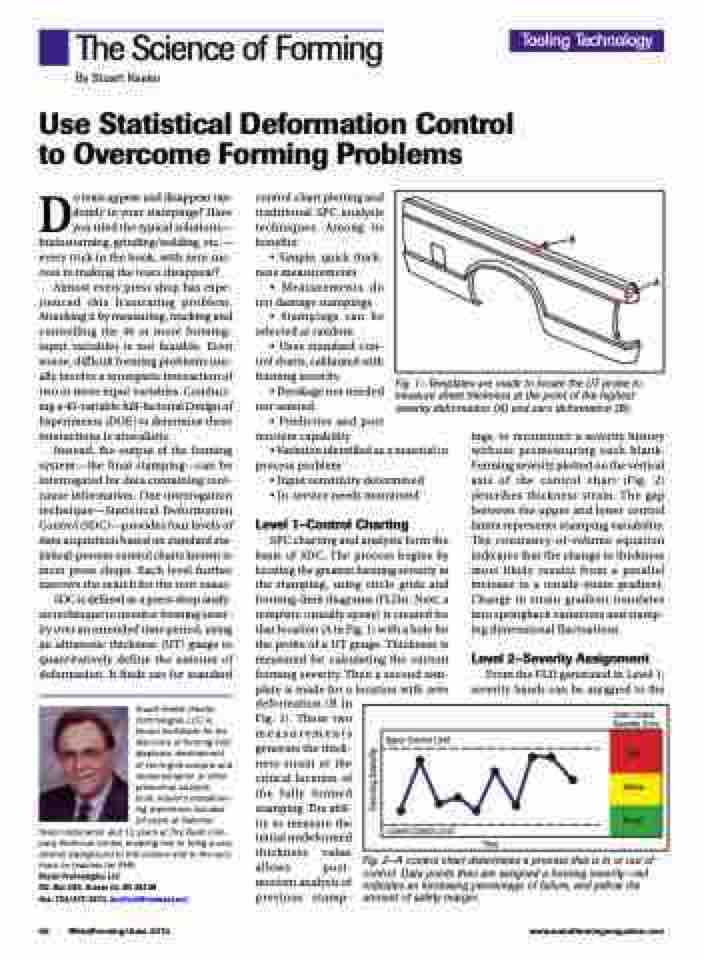
forming severity Fig. 1—Templates are made to locate the UT probe to • Breakage not needed measure sheet thickness at the point of the highest
nor wanted
• Predictive and post
severity deformation (A) and zero deformation (B).
mortem capability
• Variation identified as a material or
process problem
• Input sensitivity determined • In-service needs monitored
Level 1–Control Charting
SPC charting and analysis form the basis of SDC. The process begins by locating the greatest forming severity in the stamping, using circle grids and forming-limit diagrams (FLDs). Next, a template (usually epoxy) is created for that location (A in Fig. 1) with a hole for the probe of a UT gauge. Thickness is measured for calculating the current forming severity. Then a second tem-
ings, to reconstruct a severity history without premeasuring each blank. Forming severity plotted on the vertical axis of the control chart (Fig. 2) describes thickness strain. The gap between the upper and lower control limits represents stamping variability. The constancy-of-volume equation indicates that the change in thickness most likely results from a parallel increase in a tensile-strain gradient. Change in strain gradient translates into springback variations and stamp- ing dimensional fluctuations.
Level 2–Severity Assignment
From the FLD generated in Level 1, severity bands can be assigned to the
plate is made for a deformation (B in Fig. 1). These two measurements generate the thick- ness strain at the critical location of the fully formed stamping. The abil- ity to measure the initial undeformed thickness value allows post- mortem analysis of previous stamp-
location with zero
Upper Control Limit
Lower Control Limit
Color Coded Severity Zone
Red
Yellow
Time
Green
40 MetalForming/June 2012
www.metalformingmagazine.com
Fig. 2—A control chart determines a process that is in or out of control. Data points then are assigned a forming severity—red indicates an increasing percentage of failure, and yellow the amount of safety margin.
Forming Severity
