 Eren Billur
Digital Image Correlation: How it Changed the Bulge Test
March 25, 2020Comments
 In my previous column (February 2020 issue of MetalForming), I stated: “For metal formers, one of the simplest and oldest tests is the tensile test.” This column discusses the bulge test—nearly as old, with the earliest test setups built in the 1910s—digital image correlation (DIC), and the ISO 16808 standard, written in 2014.
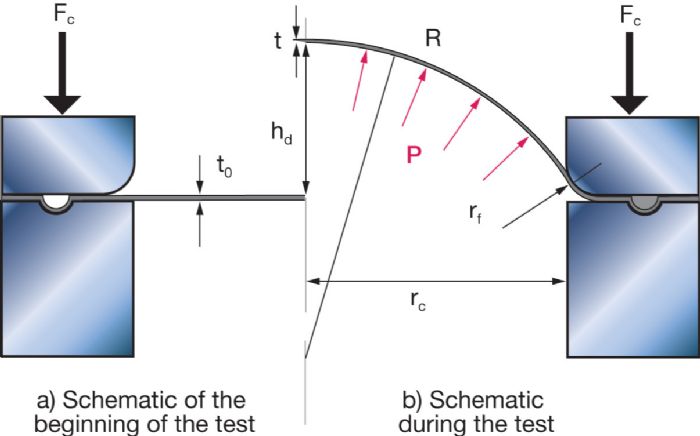
To conduct a bulge test, an operator clamps a thin sheet (t0 < 3 mm, 11 gauge or higher) between a die and a blankholder with lock beads (Fig. 1a). Under pressure, the sheet forms a dome-like shape (Fig. 1b) and we record dome height (hd) and internal pressure (P). The test continues until the sheet bursts. Note: Performing this test on advanced high-strength steels, with high ductility and strength, can lead to very high-energy bursts.
Using a Bulge Test
Performing a detailed metal forming simulation requires three data sets (or graphs) that emulate the sheet metal’s properties (Fig. 4):
- True stress/true strain curve, possibly at high strains;
- Forming limit curve (FLC); and
- Yield locus.
 During a tensile test, we strain (or stretch) the sheet in one direction which makes it a uniaxial test. Under strain, the sheet’s cross-sectional area decreases and its true stress increases. At the end of uniform elongation, the area reduction becomes so dominant that, even though the material is still hardening, the reaction force begins to decrease. As discussed in the previous article, without the use of a DIC system, generating a true strain-true stress curve at high strains with a tensile test proves challenging.
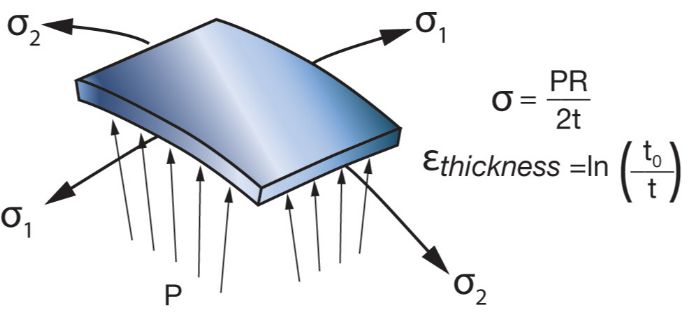
With a bulge test, we calculate true stress and true strain using the formula shown in Fig. 2, where the biaxial (two-axial) true stress equals internal pressure (P) times dome radius (R), divided by two times the instant thickness (t) at the apex. True strain is calculated from the logarithm of thickness change, similar to a tensile test.
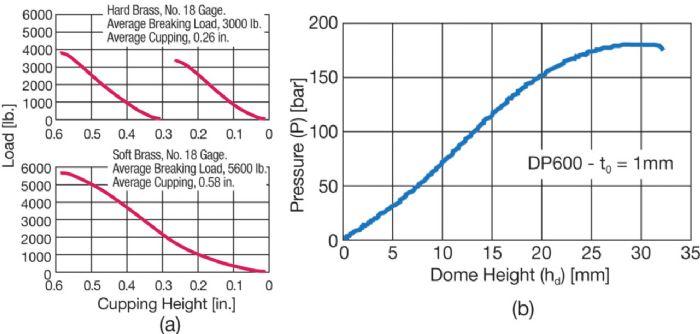 To calculate stress/strain, we must know the bulge radius (R) and thickness (t) values at several time steps during the test. While most test setups can record dome height (hd) and pressure (P) (Fig. 3), over the years many researchers, including myself, have tried to develop approximations that predict bulge radius and instant thickness from the dome height.
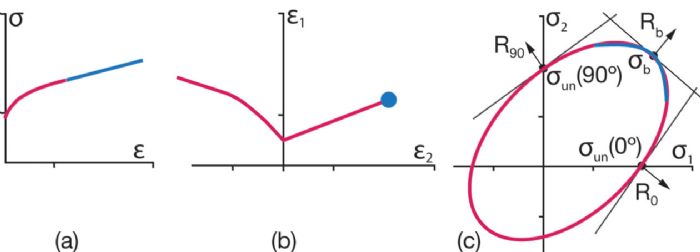 First of all, DIC almost killed the need for the bulge test, since gathering true stress data at high strains used to represent one of the most important reasons to conduct a bulge test (Fig. 4a). Now, we can gather this data when performing a tensile test with DIC.
 Webinar