
Page 48 - MetalForming-Aug-2018-issue
P. 48
The Science of Forming By Daniel J. Schaeffler, Ph.D.
Golf Shots and Manufacturing Variability
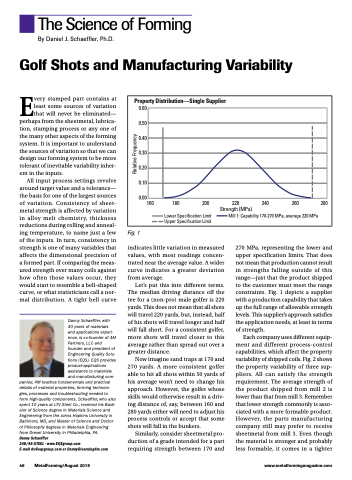
Property Distribution—Single Supplier
0.60 0.50 0.40 0.30 0.20 0.10 0.00
160 180
200
220 240 Strength (MPa)
Lower Specification Limit Upper Specification Limit
260 280 Mill 1: Capability 170-270 MPa, average 220 MPa
Every stamped part contains at least some sources of variation that will never be eliminated— perhaps from the sheetmetal, lubrica- tion, stamping process or any one of the many other aspects of the forming system. It is important to understand the sources of variation so that we can design our forming system to be more tolerant of inevitable variability inher- ent in the inputs.
All input process settings revolve around target value and a tolerance— the basis for one of the largest sources of variation. Consistency of sheet- metal strength is affected by variation in alloy melt chemistry, thickness reductions during rolling and anneal- ing temperature, to name just a few of the inputs. In turn, consistency in strength is one of many variables that affects the dimensional precision of a formed part. If comparing the meas- ured strength over many coils against how often those values occur, they would start to resemble a bell-shaped curve, or what statisticians call a nor- mal distribution. A tight bell curve
Danny Schaeffler, with
30 years of materials and applications experi- ence, is co-founder of 4M Partners, LLC and founder and president of Engineering Quality Solu- tions (EQS). EQS provides product-applications assistance to materials and manufacturing com-
panies; 4M teaches fundamentals and practical details of material properties, forming technolo- gies, processes and troubleshooting needed to form high-quality components. Schaeffler, who also spent 10 years at LTV Steel Co., received his Bach- elor of Science degree in Materials Science and Engineering from the Johns Hopkins University in Baltimore, MD, and Master of Science and Doctor of Philosophy degrees in Materials Engineering from Drexel University in Philadelphia, PA.
Danny Schaeffler
248/66-STEEL • www.EQSgroup.com
E-mail ds@eqsgroup.com or Danny@learning4m.com
Fig. 1
indicates little variation in measured values, with most readings concen- trated near the average value. A wider curve indicates a greater deviation from average.
Let’s put this into different terms. The median driving distance off the tee for a (non-pro) male golfer is 220 yards. This does not mean that all shots will travel 220 yards, but, instead, half of his shots will travel longer and half will fall short. For a consistent golfer, more shots will travel closer to this average rather than spread out over a greater distance.
Now imagine sand traps at 170 and 270 yards. A more consistent golfer able to hit all shots within 50 yards of his average won’t need to change his approach. However, the golfer whose skills would otherwise result in a driv- ing distance of, say, between 160 and 280 yards either will need to adjust his process controls or accept that some shots will fall in the bunkers.
Similarly, consider sheetmetal pro- duction of a grade intended for a part requiring strength between 170 and
270 MPa, representing the lower and upper specification limits. That does not mean that production cannot result in strengths falling outside of this range—just that the product shipped to the customer must meet the range constraints. Fig. 1 depicts a supplier with a production capability that takes up the full range of allowable strength levels. This supplier’s approach satisfies the application needs, at least in terms of strength.
Each company uses different equip- ment and different process-control capabilities, which affect the property variability of shipped coils. Fig. 2 shows the property variability of three sup- pliers. All can satisfy the strength requirement. The average strength of the product shipped from mill 2 is lower than that from mill 3. Remember that lower strength commonly is asso- ciated with a more formable product. However, the parts manufacturing company still may prefer to receive sheetmetal from mill 3. Even though the material is stronger and probably less formable, it comes in a tighter
46 MetalForming/August 2018
www.metalformingmagazine.com
Relative Frequency
