
Page 36 - MetalForming July 2016
P. 36
The Science of Forming
By Stuart Keeler
Forming-Limit Diagrams: Then and Now
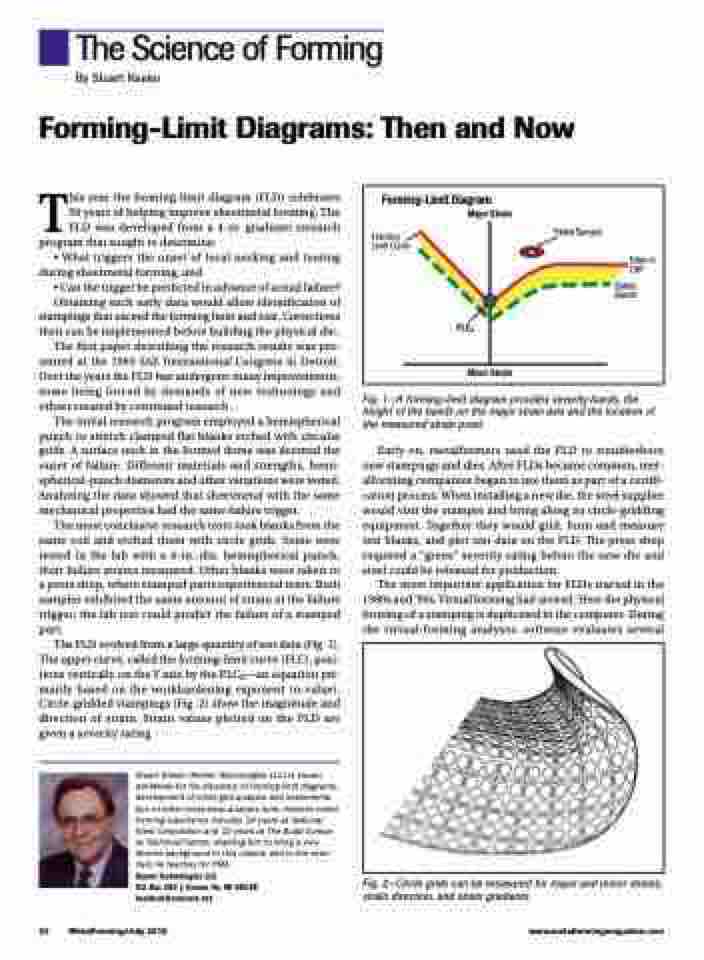
Forming-Limit Diagram
Forming- Limit Curve
Major Strain
FLC0
Minor Strain
Failed Sample
Safety Barrier
Edge of Cliff
This year the forming-limit diagram (FLD) celebrates 50 years of helping improve sheetmetal forming. The FLD was developed from a 4-yr. graduate research program that sought to determine:
• What triggers the onset of local necking and tearing during sheetmetal forming, and
• Can the trigger be predicted in advance of actual failure?
Obtaining such early data would allow identification of stampings that exceed the forming limit and tear. Corrections then can be implemented before building the physical die.
The first paper describing the research results was pre- sented at the 1965 SAE International Congress in Detroit. Over the years the FLD has undergone many improvements, some being forced by demands of new technology and others created by continued research.
The initial research program employed a hemispherical punch to stretch clamped flat blanks etched with circular grids. A surface neck in the formed dome was deemed the onset of failure. Different materials and strengths, hemi- spherical-punch diameters and other variations were tested. Analyzing the data showed that sheetmetal with the same mechanical properties had the same failure trigger.
The most conclusive research tests took blanks from the same coil and etched them with circle grids. Some were tested in the lab with a 4-in.-dia. hemispherical punch, their failure strains measured. Other blanks were taken to a press shop, where stamped parts experienced tears. Both samples exhibited the same amount of strain at the failure trigger; the lab test could predict the failure of a stamped part.
The FLD evolved from a large quantity of test data (Fig. 1). The upper curve, called the forming-limit curve (FLC), posi- tions vertically on the Y axis by the FLC0—an equation pri- marily based on the workhardening exponent (n-value). Circle-gridded stampings (Fig. 2) show the magnitude and direction of strain. Strain values plotted on the FLD are given a severity rating.
Stuart Keeler (Keeler Technologies LLC) is known worldwide for his discovery of forming limit diagrams, development of circle-grid analysis and implementa- tion of other press-shop analysis tools. Keeler’s metal- forming experience includes 24 years at National Steel Corporation and 12 years at The Budd Compa- ny Technical Center, enabling him to bring a very diverse background to this column and to the semi- nars he teaches for PMA.
Keeler Technologies LLC
P.O. Box 283 | Grosse Ile, MI 48138 keeltech@comcast.net
Fig. 1—A forming-limit diagram provides severity bands, the height of the bands on the major strain axis and the location of the measured strain point.
Early on, metalformers used the FLD to troubleshoot new stampings and dies. After FLDs became common, met- alforming companies began to use them as part of a certifi- cation process. When installing a new die, the steel supplier would visit the stamper and bring along its circle-gridding equipment. Together they would grid, form and measure test blanks, and plot test data on the FLD. The press shop required a “green” severity rating before the new die and steel could be released for production.
The most important application for FLDs started in the 1980s and ’90s. Virtual forming had arrived. Here the physical forming of a stamping is duplicated in the computer. During the virtual-forming analyses, software evaluates several
Fig. 2—Circle grids can be measured for major and minor strains, strain direction, and strain gradients.
34 MetalForming/July 2016
www.metalformingmagazine.com
