
Page 21 - MetalForming April 2016
P. 21
demands of increased activity.
MF
Best Practices
Annual Revenues in Millions
30%
20%
10%
23%
26%
$20-49 million
28%
More than $50 million
0% Less than $5 million
$5-9 $10-19 million million
10%
13%
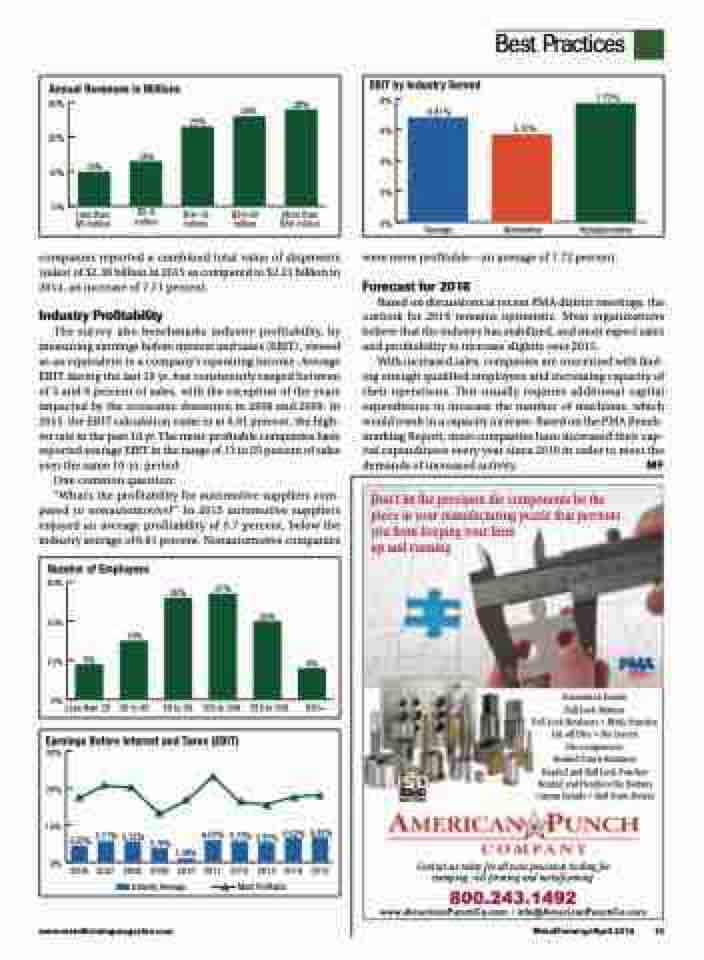
EBIT by Industry Served
8% 6% 4% 2% 0%
6.81%
Average
5.70%
Automotive
7.72%
Nonautomotive
companies reported a combined total value of shipments (sales) of $2.38 billion in 2015 as compared to $2.21 billion in 2014, an increase of 7.71 percent.
Industry Profitability
The survey also benchmarks industry profitability, by measuring earnings before interest and taxes (EBIT), viewed as an equivalent to a company’s operating income. Average EBIT during the last 10 yr. has consistently ranged between of 5 and 6 percent of sales, with the exception of the years impacted by the economic downturn in 2008 and 2009. In 2015, the EBIT calculation came in at 6.81 percent, the high- est rate in the past 10 yr. The most-profitable companies have reported average EBIT in the range of 13 to 25 percent of sales over the same 10-yr. period.
One common question:
“What’s the profitability for automotive suppliers com- pared to nonautomotive?” In 2015 automotive suppliers enjoyed an average profitability of 5.7 percent, below the industry average of 6.81 percent. Nonautomotive companies
were more profitable—an average of 7.72 percent.
Forecast for 2016
Based on discussions at recent PMA district meetings, the outlook for 2016 remains optimistic. Most organizations believe that the industry has stabilized, and most expect sales and profitability to increase slightly over 2015.
With increased sales, companies are concerned with find- ing enough qualified employees and increasing capacity of their operations. This usually requires additional capital expenditures to increase the number of machines, which would result in a capacity increase. Based on the PMA Bench- marking Report, most companies have increased their cap- ital expenditures every year since 2010 in order to meet the
Don’t let the precision die components be the piece in your manufacturing puzzle that prevents you from keeping your lines
up and running.
Automation Details Ball Lock Buttons
a
B
B
all Lock Retainers • Blade Punches Cut-off Dies • Die Inserts
Die Components Headed Punch Retainers Headed and Ball Lock Punches
Headed and Headless Die Buttons
H
C
ustom Details • Roll Form Details
C
u
Contact us today for all your precision tooling for stamping, roll forming and metalforming.
800.243.1492
www.AmericanPunchCo.com • info@AmericanPunchCo.com
Number of Employees
30%
20%
10%
0%
26%
50 to 99
27%
20%
15% 9%
8%
250 to 500 500+
Less than 20
20 to 49
100 to 249
Earnings Before Interest and Taxes (EBIT)
30%
20%
10%
0%
4.52% 5.71% 5.72%
3.78%
1.08%
6.01% 5.72% 5.32% 6.62% 6.81%
2006 2007 2008 2009 2010 2011 2012 2013 2014 2015
Industry Average Most Profitable
www.metalformingmagazine.com
MetalForming/April 2016 19
