
Page 20 - MetalForming April 2016
P. 20
Best Practices
By Bob Dobrowsky
2015 Benchmarking Survey Indicates Industry Has Stabilized
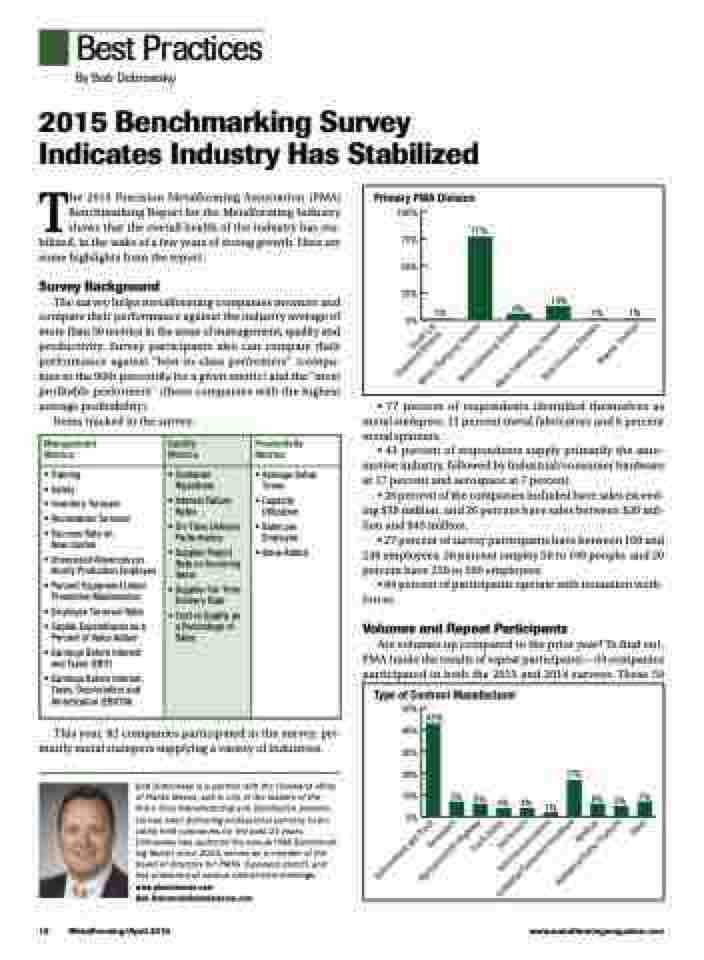
Primary PMA Division
100% 75% 50% 25% 0%
77%
1%
1% 1%
6%
13%
The 2015 Precision Metalforming Association (PMA) Benchmarking Report for the Metalforming Industry shows that the overall health of the industry has sta- bilized, in the wake of a few years of strong growth. Here are some highlights from the report.
Survey Background
The survey helps metalforming companies measure and compare their performance against the industry average of more than 50 metrics in the areas of management, quality and productivity. Survey participants also can compare their performance against “best-in-class performers” (compa- nies in the 90th percentile for a given metric) and the “most profitable performers” (those companies with the highest average profitability).
Items tracked in the survey:
• 77 percent of respondents identified themselves as metal stampers, 13 percent metal fabricators and 6 percent metal spinners.
• 43 percent of respondents supply primarily the auto- motive industry, followed by Industrial/consumer hardware at 17 percent and aerospace at 7 percent.
• 28 percent of the companies included have sales exceed- ing $50 million, and 26 percent have sales between $20 mil- lion and $49 million.
• 27 percent of survey participants have between 100 and 249 employees; 26 percent employ 50 to 100 people; and 20 percent have 250 to 500 employees.
• 84 percent of participants operate with nonunion work- forces.
Volumes and Repeat Participants
Are volumes up compared to the prior year? To find out, PMA tracks the results of repeat participants—59 companies participated in both the 2015 and 2014 surveys. These 59
Management Metrics
Quality Metrics
Productivity Metrics
• Training
• Safety
• Inventory Turnover
• Receivables Turnover
• Success Rate on New Quotes
• Unexcused Absences per Hourly Production Employee
• Percent Equipment Under Preventive Maintenance
• Employee Turnover Ratio
• Capital Expenditures as a Percent of Value Added
• Earnings Before Interest and Taxes (EBIT)
• Earnings Before Interest, Taxes, Depreciation and Amortization (EBITDA)
• Customer Rejections
• Internal Failure Rates
• On-Time Delivery Performance
• Supplier Reject Rate on Incoming Items
• Supplier On-Time Delivery Rate
• Cost of Quality as a Percentage of Sales
• Average Setup Times
• Capacity Utilization
• Sales per Employee
• Value Added
Type of Contract Manufacturer
50%
43%
40% 30% 20% 10%
0%
17%
7% 6% 4% 4%
1%
6% 5% 7%
This year, 82 companies participated in the survey, pri- marily metal stampers supplying a variety of industries.
Bob Dobrowsky is a partner with the Cleveland office of Plante Moran, and is one of the leaders of the firm’s Ohio Manufacturing and Distribution practice. He has been delivering professional services to pri- vately held companies for the past 21 years. Dobrowsky has authored the annual PMA Benchmark- ing Report since 2003, serves as a member of the board of directors for PMA’s Cleveland district, and has presented at various district-level meetings. www.plantemoran.com
Bob.Dobrowsky@plantemoran.com
18 MetalForming/April 2016
www.metalformingmagazine.com
Automotive/Light Truck Aerospace
Agriculture/Off-Highway Truck Heavy
Electronics Telecommunications Industrial/Consumer Hardware
Medical Appliance/Home Products
Other
Small Lot Stamping Division
Metal Stamping Division
Metal Spinning Division
Metal Fabricating Division
Slide Forming Division
Washer Division
