
Page 43 - MetalForming March 2016
P. 43
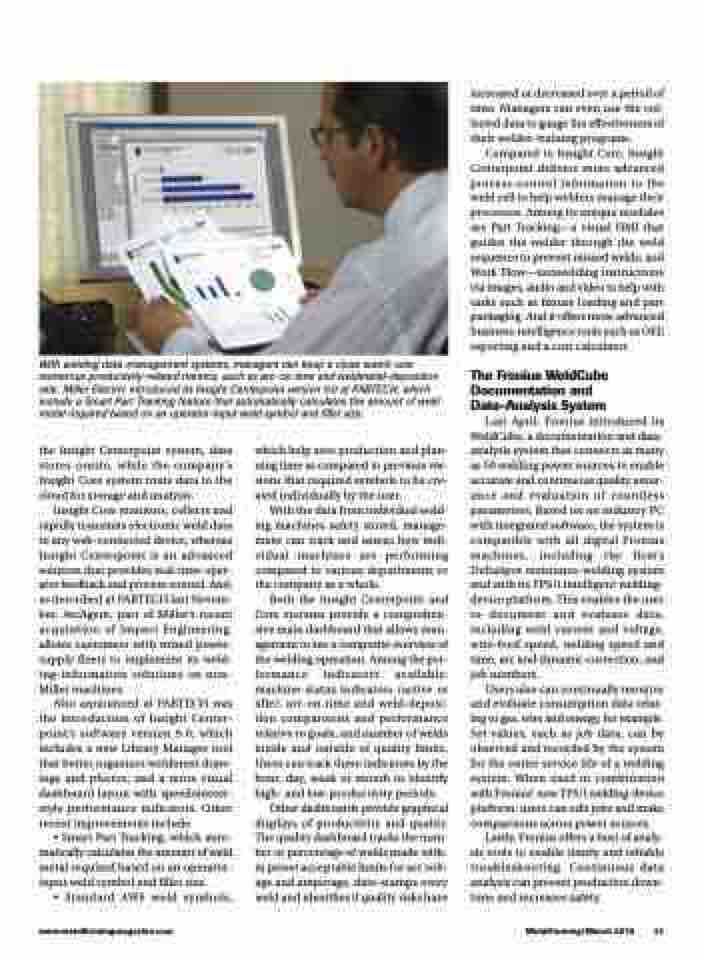
 With welding data-management systems, managers can keep a close watch over numerous productivity-related metrics, such as arc-on time and weldmetal-deposition rate. Miller Electric introduced its Insight Centerpoint version 9.0 at FABTECH, which include a Smart Part Tracking feature that automatically calculates the amount of weld metal required based on an operator-input weld symbol and fillet size.
increased or decreased over a period of time. Managers can even use the col- lected data to gauge the effectiveness of their welder-training programs.
Compared to Insight Core, Insight Centerpoint delivers more advanced process-control information to the weld cell to help welders manage their processes. Among its unique modules are Part Tracking—a visual HMI that guides the welder through the weld sequence to prevent missed welds; and Work Flow—nonwelding instructions via images, audio and video to help with tasks such as fixture loading and part packaging. And it offers more advanced business-intelligence tools such as OEE reporting and a cost calculator.
The Fronius WeldCube Documentation and Data-Analysis System
Last April, Fronius introduced its WeldCube, a documentation and data- analysis system that connects as many as 50 welding power sources to enable accurate and continuous quality assur- ance and evaluation of countless parameters. Based on an industry PC with integrated software, the system is compatible with all digital Fronius machines, including the firm’s DeltaSpot resistance-welding system and with its TPS/i intelligent welding- device platform. This enables the user to document and evaluate data, including weld current and voltage, wire-feed speed, welding speed and time, arc and dynamic correction, and job numbers.
Users also can continually monitor and evaluate consumption data relat- ing to gas, wire and energy, for example. Set values, such as job data, can be observed and recorded by the system for the entire service life of a welding system. When used in combination with Fronius’ new TPS/i welding-device platform, users can edit jobs and make comparisons across power sources.
Lastly, Fronius offers a host of analy- sis tools to enable timely and reliable troubleshooting. Continuous data analysis can prevent production down- time and increases safety.
the Insight Centerpoint system, data stores onsite, while the company’s Insight Core system routs data to the cloud for storage and analysis.
Insight Core monitors, collects and rapidly transmits electronic weld data to any web-connected device, whereas Insight Centerpoint is an advanced solution that provides real-time oper- ator feedback and process control. And, as described at FABTECH last Novem- ber, ArcAgent, part of Miller’s recent acquisition of Impact Engineering, allows customers with mixed power- supply fleets to implement its weld- ing-information solutions on non- Miller machines.
Also announced at FABTECH was the introduction of Insight Center- point’s software version 9.0, which includes a new Library Manager tool that better organizes weldment draw- ings and photos; and a more visual dashboard layout with speedometer- style performance indicators. Other recent improvements include:
• Smart Part Tracking, which auto- matically calculates the amount of weld metal required based on an operator- input weld symbol and fillet size.
• Standard AWS weld symbols,
which help save production and plan- ning time as compared to previous ver- sions that required symbols to be cre- ated individually by the user.
With the data from individual weld- ing machines safety stored, manage- ment can track and assess how indi- vidual machines are performing compared to various departments or the company as a whole.
Both the Insight Centerpoint and Core systems provide a comprehen- sive main dashboard that allows man- agement to see a composite overview of the welding operation. Among the per- formance indicators available: machine-status indicators (active or idle); arc-on-time and weld-deposi- tion comparisons and performance relative to goals; and number of welds inside and outside of quality limits. Users can track these indicators by the hour, day, week or month to identify high- and low-productivity periods.
Other dashboards provide graphical displays of productivity and quality. The quality dashboard tracks the num- ber or percentage of welds made with- in preset acceptable limits for arc volt- age and amperage, date-stamps every weld and identifies if quality risks have
www.metalformingmagazine.com
MetalForming/March 2016 41
