
Page 56 - MetalForming May 2015
P. 56
The Science of Forming By Stuart Keeler
New Technology Means Back to School
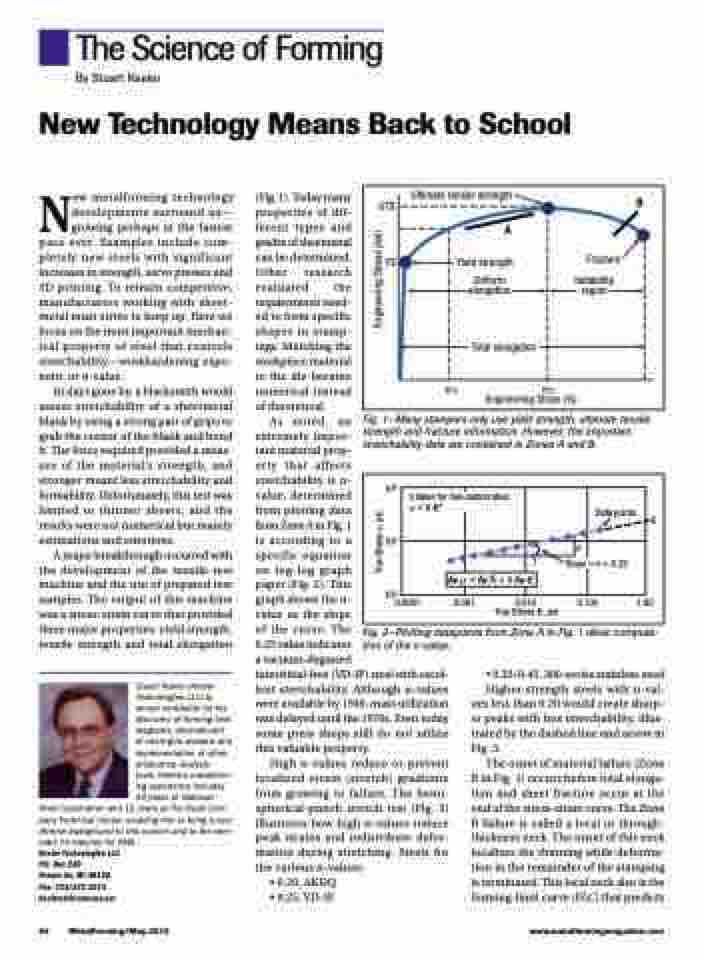
Ultimate tensile strength UTS
A
YS Yield strength
Uniform elongation
Total elongation
B
Fracture
Instability region
e10 eTS Engineering Strain (%)
New metalforming technology developments surround us— growing perhaps at the fastest pace ever. Examples include com- pletely new steels with significant increases in strength, servo presses and 3D printing. To remain competitive, manufacturers working with sheet- metal must strive to keep up. Here we focus on the most important mechan- ical property of steel that controls stretchability—workhardening expo- nent, or n-value.
In days gone by, a blacksmith would assess stretchability of a sheetmetal blank by using a strong pair of grips to grab the corner of the blank and bend it. The force required provided a meas- ure of the material’s strength, and stronger meant less stretchability and formability. Unfortunately, this test was limited to thinner sheets, and the results were not numerical but mainly estimations and emotions.
A major breakthrough occurred with the development of the tensile-test machine and the use of prepared test samples. The output of this machine was a stress-strain curve that provided three major properties: yield strength, tensile strength and total elongation
Stuart Keeler (Keeler Technologies LLC) is known worldwide for his discovery of forming limit diagrams, development of circle-grid analysis and implementation of other press-shop analysis
tools. Keeler’s metalform- ing experience includes 24 years at National
Steel Corporation and 12 years at The Budd Com- pany Technical Center, enabling him to bring a very diverse background to this column and to the sem- inars he teaches for PMA.
Keeler Technologies LLC P.O. Box 283
Grosse Ile, MI 48138 Fax: 734/671-2271 keeltech@comcast.net
(Fig. 1). Today many properties of dif- ferent types and grades of sheetmetal can be determined. Other research evaluated the requirements need- ed to form specific shapes in stamp- ings. Matching the workpiece material to the die became numerical instead of theoretical.
As noted, an
extremely impor-
tant material prop-
erty that affects
stretchability is n-
value, determined
from plotting data
from Zone A in Fig. 1
is according to a
specific equation
on log-log graph
paper (Fig. 2). This
graph shows the n-
value as the slope
of the curve. The
0.25 value indicates
a vacuum-degassed
interstitial-free (VD-IF) steel with excel- lent stretchability. Although n-values were available by 1940, mass utilization was delayed until the 1970s. Even today some press shops still do not utilize this valuable property.
High n-values reduce or prevent localized strain (stretch) gradients from growing to failure. The hemi- spherical-punch stretch test (Fig. 3) illustrates how high n-values reduce peak strains and redistribute defor- mation during stretching. Steels for the various n-values:
• 0.20, AKDQ • 0.25, VD-IF
Fig. 1—Many stampers only use yield strength, ultimate tensile strength and fracture information. However, the important stretchability data are contained in Zones A and B.
105
104
K
0.100 1.00
n Value for low-carbon steel =Kn
103
0.0001 0.001 0.010
True Stress , psi
Data points
1
n Slope
ln=lnK+nln
=n=0.25
Fig. 2—Plotting datapoints from Zone A in Fig. 1 allow computa- tion of the n-value..
• 0.35/0.45, 300-series stainless steel
Higher-strength steels with n-val- ues less than 0.20 would create sharp- er peaks with less stretchability, illus- trated by the dashed line and arrow in Fig. 3.
The onset of material failure (Zone B in Fig. 1) occurs before total elonga- tion and sheet fracture occur at the end of the stress-strain curve. The Zone B failure is called a local or through- thickness neck. The onset of this neck localizes the thinning while deforma- tion in the remainder of the stamping is terminated. This local neck also is the forming-limit curve (FLC) that predicts
54 MetalForming/May 2015
www.metalformingmagazine.com
True Stress , psi Engineering Stress (ksi)
