
Page 46 - MetalForming January 2015
P. 46
The Science of Forming By Stuart Keeler
Simple Graphics Can Send the Wrong Message
The world is full of pictures, graphs, charts, videos and other media types that improve communica- tion when compared to the mere writ- ten word. The scientific world uses a similar but more complex approach. Here, print communication augment- ed by informative graphics is more powerful and easier to understand than a page full of printed technical infor- mation. However, too often authors will confuse things by interweaving groups of concepts into a single graph to show interactions—for example, “if A goes to B then C will change the value ofD.”
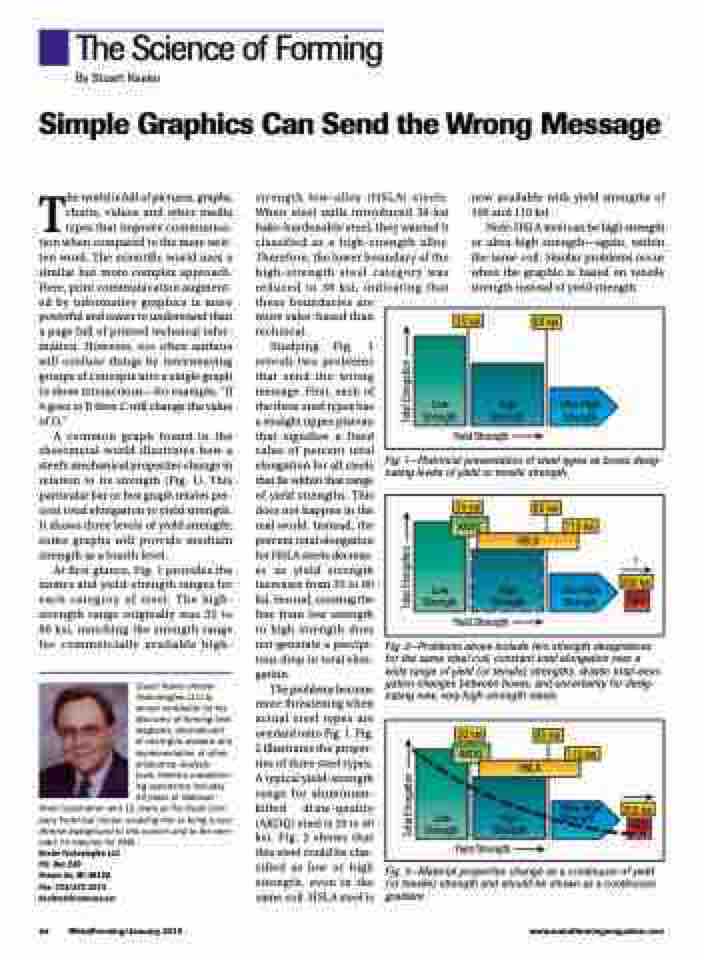
A common graph found in the sheetmetal world illustrates how a steel’s mechanical properties change in relation to its strength (Fig. 1). This particular bar or box graph relates per- cent total elongation to yield strength. It shows three levels of yield strength; some graphs will provide medium strength as a fourth level.
At first glance, Fig. 1 provides the names and yield-strength ranges for each category of steel. The high- strength range originally was 35 to 80 ksi, matching the strength range for commercially available high-
Stuart Keeler (Keeler Technologies LLC) is known worldwide for his discovery of forming limit diagrams, development of circle-grid analysis and implementation of other press-shop analysis
tools. Keeler’s metalform- ing experience includes 24 years at National
Steel Corporation and 12 years at The Budd Com- pany Technical Center, enabling him to bring a very diverse background to this column and to the sem- inars he teaches for PMA.
Keeler Technologies LLC P.O. Box 283
Grosse Ile, MI 48138 Fax: 734/671-2271 keeltech@comcast.net
strength low-alloy (HSLA) steels. When steel mills introduced 30-ksi bake-hardenable steel, they wanted it classified as a high-strength alloy. Therefore, the lower boundary of the high-strength steel category was reduced to 30 ksi, indicating that these boundaries are
now available with yield strengths of 100 and 110 ksi.
Note: HSLA steel can be high strength or ultra-high strength—again, within the same coil. Similar problems occur when the graphic is based on tensile strength instead of yield strength.
30 ksi 80 ksi
Yield Strength
Ultra-High Strength
Low Strength
High Strength
more sales-based than technical.
Studying Fig. 1 reveals two problems that send the wrong message. First, each of the three steel types has a straight upper plateau that signifies a fixed value of percent total elongation for all steels that lie within that range of yield strengths. This does not happen in the real world. Instead, the percent total elongation for HSLA steels decreas- es as yield strength increases from 35 to 80 ksi. Second, crossing the line from low strength to high strength does not generate a precipi- tous drop in total elon- gation.
The problems become more threatening when actual steel types are overlaid onto Fig. 1. Fig. 2 illustrates the proper- ties of three steel types. A typical yield-strength range for aluminum- killed draw-quality (AKDQ) steel is 20 to 40 ksi. Fig. 2 shows that this steel could be clas- sified as low or high strength, even in the same coil. HSLA steel is
Fig. 1—Historical presentation of steel types as boxes desig- nating levels of yield or tensile strength.
30 ksi
AKDQ
HSLA
80 ksi
110 ksi
?
200 ksi
MS
Low Strength
High Ultra-High Strength Strength
Yield Strength
Fig. 2—Problems above include two strength designations for the same steel coil, constant total elongation over a wide range of yield (or tensile) strengths, drastic total-elon- gation changes between boxes, and uncertainty for desig- nating new, very high-strength steels.
30 ksi
80 ksi
200 ksi
MS
Low Strength
AKDQ
Yield Strength
HSLA
110 ksi
High Strength
Ultra-High Strength
44 MetalForming/January 2015
www.metalformingmagazine.com
Fig. 3—Material properties change as a continuum of yield (or tensile) strength and should be shown as a continuous gradient.
Total Elongation
Total Elongation Total Elongation
