
Page 34 - MetalForming November 2013
P. 34
The Science of Forming
By Stuart Keeler
Sheetmetal Basics—Data and Experiments
Data holds the key that allows one to assign a definable, numerical value to an item, process, event and even life itself. We assign, assess and live by data. Two rules should become mandatory guidelines for any discussion about any subject in your life:
• Any opinion without data is simply a guess.
• Any solution without data is simply a guess.
With every step along the life cycle of a stamped metal
part, from the initial sketch to the in-service performance of the final part, decisions must be guided by data. Historical- ly, obtaining accurate data usually was reserved as a last- chance attempt to solve a problem. Instead, many nondata paths were first attempted, often beginning with this or some similar statement:
“Thirty years ago I had a challenging part similar to this one, and we had to design a more generous radius at this location.” Researchers have identified 40, 50 or more inputs to the forming system that interact with each other to generate the final stamping. Thirty years ago, how many inputs of that stamping were identified and measured numerically to obtain any data applicable to today’s problem stamping? Maybe three or four, or perhaps none. Even if the inputs were measured, the presses, dies, metals and lubricants are com- pletely different today than 30 years ago. Most of those ancient trial-and-error problem/solutions have no rela-
tionship with today’s more complex stampings. Nowadays, troubleshooting any pressroom challenge
should follow a three-step process, based on data.
Step 1: Numerically define the problem. Having a numer- ical definition of the problem represents half of the solution. The numerical definition defines the starting or reference point for the problem/solution—no-good, improve, fix, get better steel or #*%!$ are not numerical and merely impede the process. In contrast, proving that the strain level exceeds the forming-limit curve and breakage is expected provides a significant reference base, alerting the pressroom supervisor.
He now knows to reduce the deformation at this level.
Stuart Keeler (Keeler Technologies LLC) is known worldwide for his discovery of forming limit diagrams, development of circle-grid analysis and implementa- tion of other press-shop analysis tools. Keeler’s metal- forming experience includes 24 years at National Steel Corporation and 12 years at The Budd Company Technical Center, enabling him to bring a very diverse background to this column and to the seminars he teaches for PMA.
Keeler Technologies LLC
P.O. Box 283 | Grosse Ile, MI 48138 Fax: 734/671-2271 keeltech@comcast.net
Step 2: Numerically define the end goal. Again, fix, improve, get better steel, etc. are end goals that one can never reach. Instead, strain values in the safe portion of the form- ing-limit curve are required, and usually attainable, end goals.
Step 3: Numerically tracking the process from the numer- ical starting goal toward the end goal. Are you headed direct- ly and efficiently toward your numerical end goal, or are you heading in the wrong direction? Or, are you in a time-wast- ing circle? The tracking process keeps you on the most effi- cient path.
Obtaining data by itself rarely solves a problem. Data must be converted into information used to solve the prob- lem. In step 3 above, the data simply confirms if you are head- ing in the right or wrong direction. Discovering possible corrections to move in the right direction requires gathering information about the behavior of the stamping and form- ing process. The alternative: making many blind trial-and- error attempts, without success.
The concept of turning data into information escapes many companies—either by intent or by lack of capable per- sonnel. Every Monday afternoon, a press-shop quality man- ager posts statistical-process-control charts from the pre- vious week on the office wall. When asked if the charts were calculated and posted day by day in the press shop during the previous week and then transferred to the office hall, he answers: “Oh no. I compute and plot them every Monday morning and post them that afternoon.” Obviously the charts contain lots of useful data, yet it is not being converted into information and transmitted to press-shop personnel each day. When asked why he makes and posts the charts, the manager says that customers like to see them—a wasted opportunity.
Tooling Technology
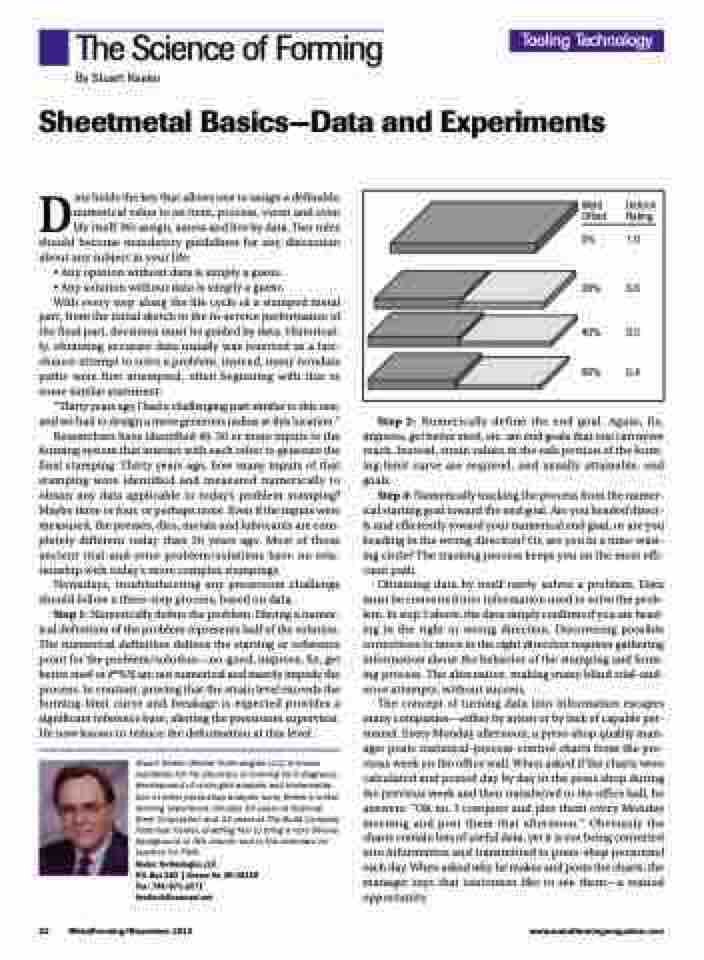
Weld Deform Offset Rating
0% 1.0
20% 0.6
40% 0.5
60% 0.4
32 MetalForming/November 2013
www.metalformingmagazine.com
