
Page 50 - MetalForming June 2013
P. 50
Tooling Technology
pricetag and divide it by the cost of outsourcing the simulation for one die. The result is the number of simulated parts needed to attain an annual break- even point. If your actual quantity of dies is less than this number, then out- sourcing makes sense, but if the num- ber of dies exceeds than this number, investing in the software will pay off.
The payback analysis, or return on investment, depends on how many part numbers will require simulation in one year. Take the number of parts you plan to simulate in one year and mul- tiply by the cost of outsourcing each simulation. Then take that number and subtract the cost of the software. This is the net savings; ROI is net savings divided by the annual cost of the soft- ware lease.
Knowing that using incremental forming-simulation technology is the cost of doing business today, any addi- tional value gained by avoiding tryout issues or solving production problems is what financial folks call residual value. Us die guys just call that gravy. Whatever you decide to call it, the only value you can reliably quantify is the inhouse versus outsource decision.
Optimizing Simulation Accuracy
With a simulation platform selected, the job becomes ensuring that the results of the simulations replicate actual production results as closely as possible. Studies I have recently per- formed reveal that simulation results can consistently correlate to actual stampings within one percent, provid- ed certain guidelines are followed when deploying the simulation software.
First, while every software platform comes loaded with database of material properties, these libraries are generic values for generic materials. If your goal is to predict stamping perform- ance under worst-case production con- ditions with production sheetmetal, these generic material properties sim- ply will not suffice. Ask your customer to define the specific material proper- ties for its stampings by providing you with a stress/strain curve plus n- and r- values. If they are not able to or willing
to do this, then run your simulations with material properties at worst case values. This equates to the highest yield strength and tensile strength, and low- est n- and r-values.
Run solver settings that provide the most accurate and refined calculations for production-stamping feasibility and validation. This roughly equates to using eight elements in each radius; having initial element sizes no longer than 20 mm; slicing the material thick- ness into 11 layers; and using relative- ly small time steps.
Post-Processing Standards
A simulation with correct die-face engineering, correct preprocessing and correct solver parameters is useless if the interpretation of the results is incor- rect. The engineer must define the con- ditions or requirements that enable the project to continue or stop, by using specific pass/fail criteria.
Always begin with the forming-limit diagram (FLD) and the safety margin needed to account for real-world pro- duction variables not accounted for in the simulation. At Johnson Controls, the stampings I am responsible for must pass stringent government-man- dated safety standards, so I use a 20- percent safety margin. Other indus- tries may use a 10-percent safety margin.
The safety margin defines pass/fail. If all elements fall below the FLD mar- ginal limit line, the stamping is FLD safe—pass. If any element touches or lands above the marginal limit line, the stamping is not FLD safe—fail.
The formability review continues only if the stamping is FLD safe, by analyzing thinning and thickening at the die-cut features. Why just the die cut features? First, unless the product design has a maximum thinning requirement for, say, vehicle safety, then the FLD shows if the combination of forming mode (plane strain, draw or stretch) and the strain capability of the material is sufficient to produce the formed feature without splits. Thin- ning capability for a given material type and thickness varies with product geometry and forming mode.
Second, it is beyond the current capability of simulation technology to replicate the localized work hardening and fracture, due to cold-work die cut- ting at trimmed or punched features. Why is this important to the analysis of simulation results? The software cannot predict edge cracks at die-cut features. Sheetmetal can have tensile or com- pression edge cracks even with a pass- ing FLD.
To solve this dilemma, we use max- imum allowable thinning and thick- ening percentages at die-cut features to predict edge cracks. The percentage varies with material type and thick- ness. JCI has extensively researched and tested the family of material it uses in its products to determine the maxi- mum allowable percentages to prevent edge cracks. You need to consider your own edge-crack conditions and devel- op the criteria needed to determine pass/fail.
Do what works for you and do it consistently. Pass or fail. MF
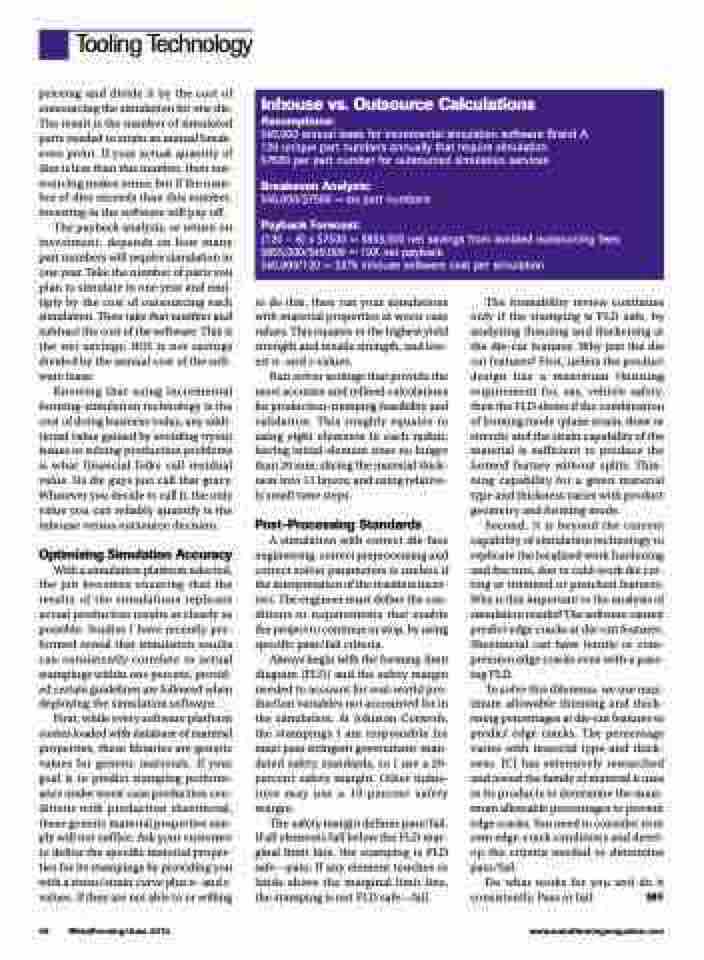
Inhouse vs. Outsource Calculations
Assumptions:
$45,000 annual lease for incremental simulation software Brand A 120 unique part numbers annually that require simulation
$7500 per part number for outsourced simulation services
Breakeven Analysis:
$45,000/$7500 = six part numbers
Payback Forecast:
(120 – 6) x $7500 = $855,000 net savings from avoided outsourcing fees $855,000/$45,000 = 19X net payback
$45,000/120 = $375 inhouse software cost per simulation
48 MetalForming/June 2013
www.metalformingmagazine.com
