
Page 48 - MetalForming March 2013
P. 48
The Science of Forming
By Stuart Keeler
Sheetmetal Data Needs Validity and Quality
Access to data provides a significant advantage when solving press-shop problems, as long as the data pass the validity and quality tests. Validity is the opposite of guessing—when challenged, one must prove the data direct- ly relate to the problem being evaluated, and specify the con- ditions during the problem.
Too often one hears, “We made good stampings when we used the same type steel in this die and press last month.” However, during last month’s run how many of the input vari- ables to the forming system for each stamping were record- ed? Probably none. How many were recorded during today’s problematic run? Probably none. Instead, plenty of sugges- tions about the cause of the problem most likely are being dis- cussed or even acted on without a single piece of valid data.
Another concern are the processes used to acquire the data. Consider, for example, use of an ultrasonic thickness gauge (UTG) to measure the amount of thinning in a stamp- ing. While the readings—correctly copied and used for prob- lem analysis—may be valid, the data displayed by the UTG may not always be valid representations of the thinning experienced by the stampings. Perhaps the gauge has been improperly calibrated, or is not being operated with the correct probe or settings.
Shortcuts often create invalid data, due to invalid assump- tions. Because a failed stamping proves difficult to measure, we assume that the good stampings made just before and after the failed stamping reflect the conditions in the failed stamping. If true, then why didn’t the stampings before and after also fail? Something different happened in the failed stamping and only that stamping will contain valid data for problem solving.
Passing the Quality Test
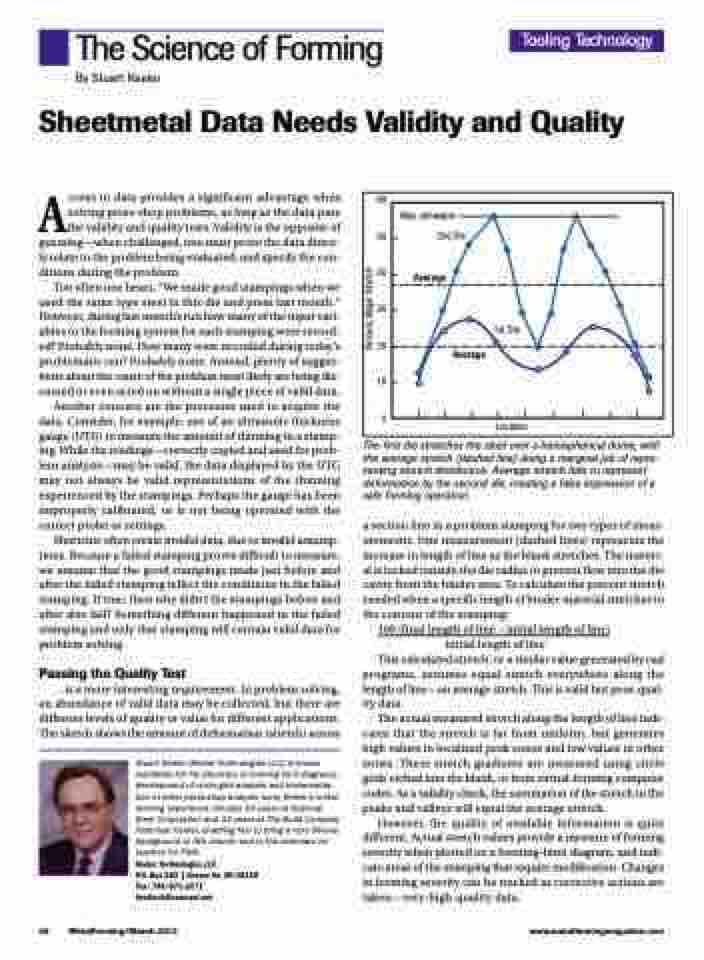
...is a more interesting requirement. In problem solving, an abundance of valid data may be collected, but there are different levels of quality or value for different applications. The sketch shows the amount of deformation (stretch) across
Stuart Keeler (Keeler Technologies LLC) is known worldwide for his discovery of forming limit diagrams, development of circle-grid analysis and implementa- tion of other press-shop analysis tools. Keeler’s metal- forming experience includes 24 years at National Steel Corporation and 12 years at The Budd Company Technical Center, enabling him to bring a very diverse background to this column and to the seminars he teaches for PMA.
Keeler Technologies LLC
P.O. Box 283 | Grosse Ile, MI 48138 Fax: 734/671-2271 keeltech@comcast.net
The first die stretches the steel over a hemispherical dome, with the average stretch (dashed line) doing a marginal job of repre- senting stretch distribution. Average stretch fails to represent deformation by the second die, creating a false impression of a safe forming operation.
a section line in a problem stamping for two types of meas- urements. One measurement (dashed lines) represents the increase in length of line as the blank stretches. The materi- al is locked outside the die radius to prevent flow into the die cavity from the binder area. To calculate the percent stretch needed when a specific length of binder material stretches to the contour of the stamping:
100 (final length of line – initial length of line) initial length of line
This calculated stretch, or a similar value generated by cad programs, assumes equal stretch everywhere along the length of line—an average stretch. This is valid but poor-qual- ity data.
The actual measured stretch along the length of line indi- cates that the stretch is far from uniform, but generates high values in localized peak zones and low values in other zones. These stretch gradients are measured using circle grids etched into the blank, or from virtual-forming computer codes. As a validity check, the summation of the stretch in the peaks and valleys will equal the average stretch.
However, the quality of available information is quite different. Actual stretch values provide a measure of forming severity when plotted on a forming-limit diagram, and indi- cate areas of the stamping that require modification. Changes in forming severity can be tracked as corrective actions are taken—very-high-quality data.
Tooling Technology
60
50
40
30
20
10
0
Location
Max. allowable 2nd Die
Average
1st Die
Average
46 MetalForming/March 2013
www.metalformingmagazine.com
Percent, Major Stretch
