
Page 36 - MetalForming January 2012
P. 36
The Science of Forming By Stuart Keeler
Tooling Technology
Use Raw Data–Averages Lose Information
We all love to average data. A friend recently said that he averaged 65 miles/hr. on his last trip, affec- tively hiding the many miles driven well above the speed limit to compensate for driving slowly through a construction zone and stopping to replace a flat tire. While an average is easy to use in a report or conversa- tion, an average often (inten- tionally or not) hides critical information needed to under- stand the scope of a problem, and masks possible avenues for troubleshooting.
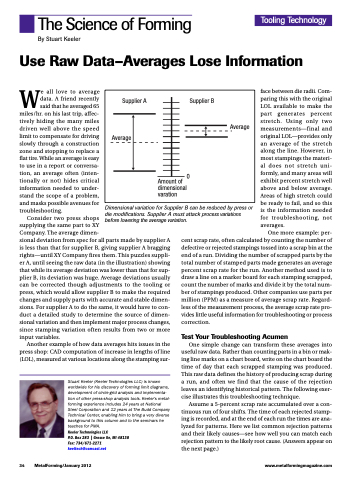
Consider two press shops
supplying the same part to XY
Company. The average dimen-
sional deviation from spec for all parts made by supplier A is less than that for supplier B, giving supplier A bragging rights—until XY Company fires them. This puzzles suppli- er A, until seeing the raw data (in the illustration) showing that while its average deviation was lower than that for sup- plier B, its deviation was huge. Average deviations usually can be corrected though adjustments to the tooling or press, which would allow supplier B to make the required changes and supply parts with accurate and stable dimen- sions. For supplier A to do the same, it would have to con- duct a detailed study to determine the source of dimen- sional variation and then implement major process changes, since stamping variation often results from two or more input variables.
Another example of how data averages hits issues in the press shop: CAD computation of increase in lengths of line (LOL), measured at various locations along the stamping sur-
Stuart Keeler (Keeler Technologies LLC) is known worldwide for his discovery of forming limit diagrams, development of circle-grid analysis and implementa- tion of other press-shop analysis tools. Keeler’s metal- forming experience includes 24 years at National Steel Corporation and 12 years at The Budd Company Technical Center, enabling him to bring a very diverse background to this column and to the seminars he teaches for PMA.
Keeler Technologies LLC
P.O. Box 283 | Grosse Ile, MI 48138 Fax: 734/671-2271 keeltech@comcast.net
face between die radii. Com- paring this with the original LOL available to make the part generates percent stretch. Using only two measurements—final and original LOL—provides only an average of the stretch along the line. However, in most stampings the materi- al does not stretch uni- formly, and many areas will exhibit percent stretch well above and below average. Areas of high stretch could be ready to fail, and so this is the information needed for troubleshooting, not averages.
One more example: per- cent scrap rate, often calculated by counting the number of defective or rejected stampings tossed into a scrap bin at the end of a run. Dividing the number of scrapped parts by the total number of stamped parts made generates an average percent scrap rate for the run. Another method used is to draw a line on a marker board for each stamping scrapped, count the number of marks and divide it by the total num- ber of stampings produced. Other companies use parts per million (PPM) as a measure of average scrap rate. Regard- less of the measurement process, the average scrap rate pro- vides little useful information for troubleshooting or process
correction.
Test Your Troubleshooting Acumen
One simple change can transform these averages into useful raw data. Rather than counting parts in a bin or mak- ing line marks on a chart board, write on the chart board the time of day that each scrapped stamping was produced. This raw data defines the history of producing scrap during a run, and often we find that the cause of the rejection leaves an identifying historical pattern. The following exer- cise illustrates this troubleshooting technique.
Assume a 5-percent scrap rate accumulated over a con- tinuous run of four shifts. The time of each rejected stamp- ing is recorded, and at the end of each run the times are ana- lyzed for patterns. Here we list common rejection patterns and their likely causes—see how well you can match each rejection pattern to the likely root cause. (Answers appear on the next page.)
Supplier A
Average
Supplier B
0 Amount of
dimensional varation
Average
Dimensional variation for Supplier B can be reduced by press or die modifications. Supplier A must attack process variations before lowering the average variation.
34 MetalForming/January 2012
www.metalformingmagazine.com
