
Page 20 - MetalForming September 2011
P. 20
Best Practices
By Bob Dobrowsky
Converting Your Assets to Cash— How Does Your Company Stack Up?
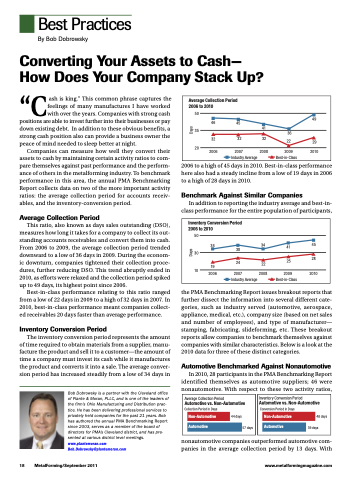
Average Collection Period 2006 to 2010
50
46
49
45
32 32 32
2006 2007 2008 Industry Average
35
20
41
36
22 29
2009 2010 Best-in-Class
“Cash is king.” This common phrase captures the feelings of many manufactures I have worked with over the years. Companies with strong cash
positions are able to invest further into their businesses or pay down existing debt. In addition to these obvious benefits, a strong cash position also can provide a business owner the peace of mind needed to sleep better at night.
Companies can measure how well they convert their assets to cash by maintaining certain activity ratios to com- pare themselves against past performance and the perform- ance of others in the metalforming industry. To benchmark performance in this area, the annual PMA Benchmarking Report collects data on two of the more important activity ratios: the average collection period for accounts receiv- ables, and the inventory-conversion period.
Average Collection Period
This ratio, also known as days sales outstanding (DSO), measures how long it takes for a company to collect its out- standing accounts receivables and convert them into cash. From 2006 to 2009, the average collection period trended downward to a low of 36 days in 2009. During the econom- ic downturn, companies tightened their collection proce- dures, further reducing DSO. This trend abruptly ended in 2010, as efforts were relaxed and the collection period spiked up to 49 days, its highest point since 2006.
Best-in-class performance relating to this ratio ranged fromalowof22daysin2009toahighof32daysin2007.In 2010, best-in-class performance meant companies collect- ed receivables 20 days faster than average performance.
Inventory Conversion Period
The inventory conversion period represents the amount of time required to obtain materials from a supplier, manu- facture the product and sell it to a customer—the amount of time a company must invest its cash while it manufactures the product and converts it into a sale. The average conver- sion period has increased steadily from a low of 34 days in
Bob Dobrowsky is a partner with the Cleveland office of Plante & Moran, PLLC, and is one of the leaders of the firm’s Ohio Manufacturing and Distribution prac- tice. He has been delivering professional services to privately held companies for the past 21 years. Bob has authored the annual PMA Benchmarking Report since 2003, serves as a member of the board of directors for PMA’s Cleveland district, and has pre- sented at various district level meetings. www.plantemoran.com
Bob.Dobrowsky@plantemoran.com
2006 to a high of 45 days in 2010. Best-in-class performance here also had a steady incline from a low of 19 days in 2006 to a high of 28 days in 2010.
Benchmark Against Similar Companies
In addition to reporting the industry average and best-in- class performance for the entire population of participants,
Inventory Conversion Period 2006 to 2010
50
30
10
34 34 38
41
25
45
28
19
2006
24
22
2007 2008
Industry Average
2009 2010
Best-in-Class
the PMA Benchmarking Report issues breakout reports that further dissect the information into several different cate- gories, such as industry served (automotive, aerospace, appliance, medical, etc.), company size (based on net sales and number of employees), and type of manufacturer— stamping, fabricating, slideforming, etc. These breakout reports allow companies to benchmark themselves against companies with similar characteristics. Below is a look at the 2010 data for three of these distinct categories.
Automotive Benchmarked Against Nonautomotive
In 2010, 28 participants in the PMA Benchmarking Report identified themselves as automotive suppliers; 46 were nonautomotive. With respect to these two activity ratios,
nonautomotive companies outperformed automotive com- panies in the average collection period by 13 days. With
Average Collection Period
Automotive vs. Non-Automotive
Collection Period in Days
Non-Automotive
44 days
57 days
Automotive
Inventory Conversion Period
Automotive vs. Non-Automotive
Conversion Period in Days
Non-Automotive
48 days 39 days
Automotive
18 MetalForming/September 2011
www.metalformingmagazine.com
Days Days
