
Page 43 - MetalForming May 2019
P. 43
The Science of Forming
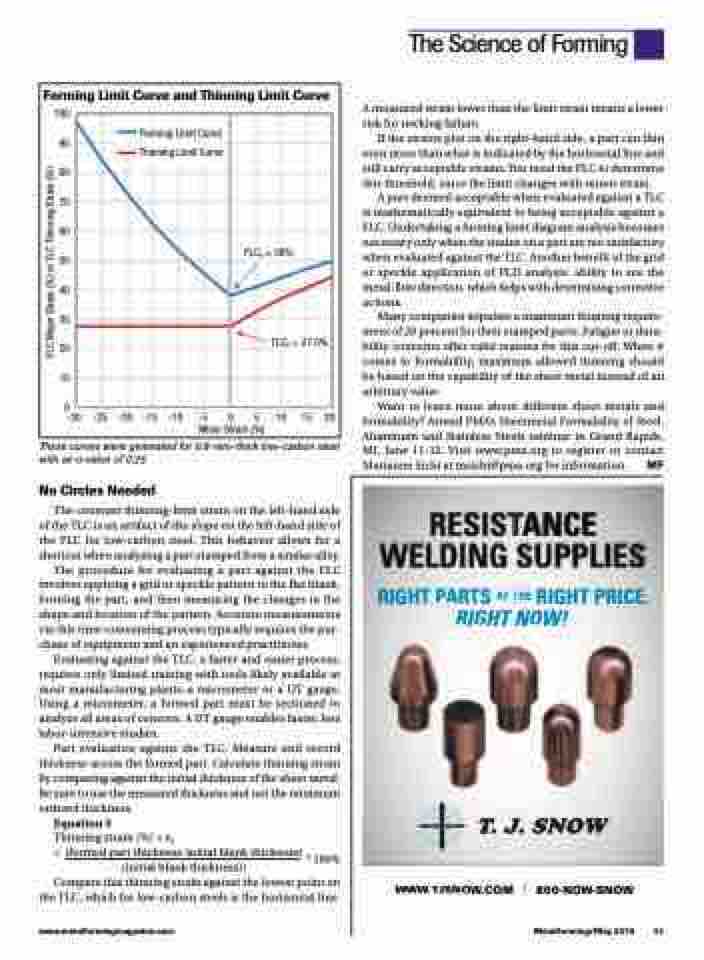
Forming Limit Curve and Thinning Limit Curve
100
90
80
70
60
50
40
30
20
10
0
-30 -25 -20 -15 -10 -5
Minor Strain (%)
Forming Limit Curve Thinning Limit Curve
FLC0 = 38%
TLC0 = 27.5%
0 5 10 15 20
These curves were generated for 0.8-mm-thick low-carbon steel with an n-value of 0.23.
No Circles Needed
The constant thinning-limit strain on the left-hand side of the TLC is an artifact of the slope on the left-hand side of the FLC for low-carbon steel. This behavior allows for a shortcut when analyzing a part stamped from a similar alloy.
The procedure for evaluating a part against the FLC involves applying a grid or speckle pattern to the flat blank, forming the part, and then measuring the changes in the shape and location of the pattern. Accurate measurements via this time-consuming process typically requires the pur- chase of equipment and an experienced practitioner.
Evaluating against the TLC, a faster and easier process, requires only limited training with tools likely available at most manufacturing plants–a micrometer or a UT gauge. Using a micrometer, a formed part must be sectioned to analyze all areas of concern. A UT gauge enables faster, less labor-intensive studies.
Part evaluation against the TLC: Measure and record thickness across the formed part. Calculate thinning strain by comparing against the initial thickness of the sheet metal. Be sure to use the measured thickness and not the minimum ordered thickness.
Equation 3
Thinning strain (%) = et
= (formed part thickness-initial blank thickness) * 100% (initial blank thickness))
Compare this thinning strain against the lowest point on the TLC, which for low-carbon steels is the horizontal line.
A measured strain lower than the limit strain means a lower risk for necking failure.
If the strains plot on the right-hand side, a part can thin even more than what is indicated by the horizontal line and still carry acceptable strains. You need the FLC to determine this threshold, since the limit changes with minor strain.
A part deemed acceptable when evaluated against a TLC is mathematically equivalent to being acceptable against a FLC. Undertaking a forming limit diagram analysis becomes necessary only when the strains on a part are not satisfactory when evaluated against the TLC. Another benefit of the grid or speckle application of FLD analysis: ability to see the metal-flow direction, which helps with determining corrective actions.
Many companies stipulate a maximum thinning require- ment of 20 percent for their stamped parts. Fatigue or dura- bility concerns offer valid reasons for this cut-off. When it comes to formability, maximum allowed thinning should be based on the capability of the sheet metal instead of an arbitrary value.
Want to learn more about different sheet metals and formability? Attend PMA’s Sheetmetal Formability of Steel, Aluminum and Stainless Steels seminar in Grand Rapids, MI, June 11-12. Visit www.pma.org to register or contact Marianne Sichi at msichi@pma.org for information. MF
RESIS
S
T
T
T
T
A
A
A
AN
NCE
G SUPPLIE
E
W LDIN
RIGHT NOW!
G
S
S
RIGHT P
T THE RIGHT PRICE,
ARTS A
A
T
www.metalformingmagazine.com
MetalForming/May 2019 41
WWW.TJSNOW.COM | 800-NOW-SNOW
FLC Major Strain (%) or TLC Thinning Strain (%)
