


Converse with Your Problematic Stampings
February 1, 2012Comments
A late 1970s project evaluated how steel strength affected forming severity of an automotive bumper formed from ground and flat polished hot-rolled steel. High-strength low-alloy steels with yield strengths of 45, 55, 65 and 80 ksi were formed in the same die with no changes to the process inputs. The 90-deg. wrap-around was the prime area of interest (Fig. 1). The three lower-strength steels formed without defects, while the 80-ksi bumper experienced local necking in the radius. While engineers in this situation may have had little information at their fingertips, the stamping knew the severity of the forming operation and was therefore interrogated for troubleshooting data using circle-grid analysis.
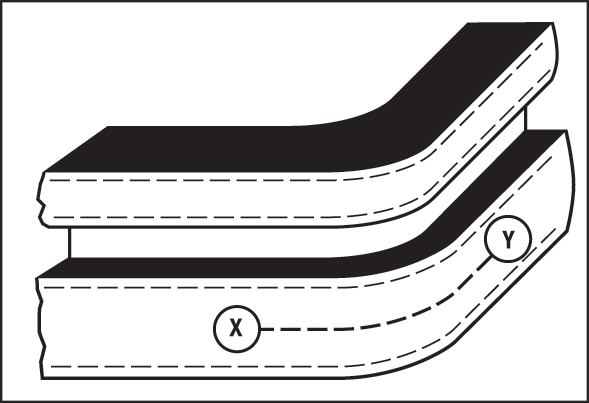 |
| Fig. 1—Stretch values measured using circle grids along line X-Y on the bumper wrap-around. |
The first question addressed: How is your available stretchability affected by an increase in yield strength? The stamping’s response (Fig. 2) comes via the actual peak stretch (bottom line) indicating that the steel becomes less able to retard growth of stretch gradients as yield strength increases. The maximum allowable stretch (top line), as determined from the forming limit curve, also decreases as yield strength increases. The difference between the two curves represents the safety factor. A zero safety factor (77-ksi yield-strength steel) means we’ve reached the edge of the deformation cliff. Steels with higher strength are subject to increased necking or tearing. Peak stretch and maximum allowable stretch vary with the work-hardening exponent (n-value), which decreases with increasing yield strength.
The next obvious question asked of the stamping: Are the two ends of your production bumper symmetrical? During the project, engineers posed this question to a problem bumper experiencing sporadic breakage only on one end—an ideal problem for troubleshooting since one stamping displays the problem while the other stamping reveals the solution. Circle grids provided comparative data (Fig. 3) showing that the driver side of the bumper underwent a higher level of stretch that exceeded the forming limit curve, while the passenger side had a peak stretch within the safe zone.
Three-Step Troubleshooting
Effective troubleshooting requires three pieces of data:
1) The current numerical definition or reference point of the problem. For this bumper, the upper curve in Fig. 3 represents the high stretch distribution causing the failures.
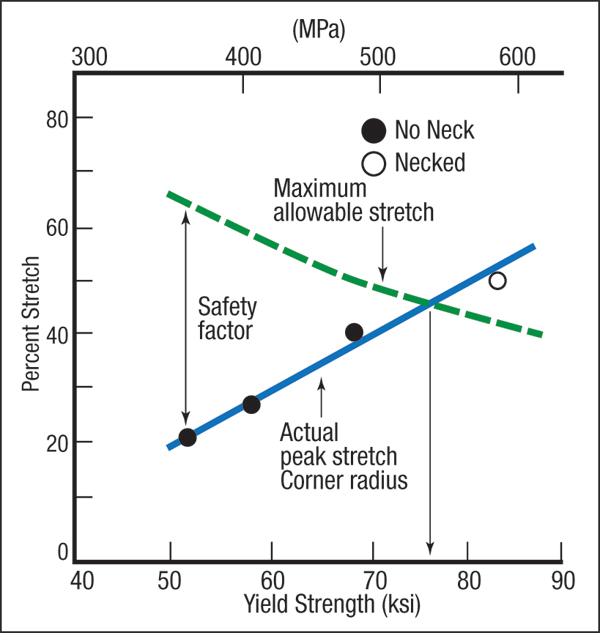 |
| Fig. 2—Stamping safety factor decreases as steel yield strength increases. |
2) A numerical end target or goal to indicate that the problem has been solved. An example: The lower curve with an adequate safety margin.
3) A numerical tracking process that indicates progress toward the target. While circle grids on the sheet surface prove useful for highlighting the details of the problem, these curves can be converted to thickness changes. An ultrasonic thickness gauge can be used to rapidly track progress (or lack thereof) without the time consuming application of grids or the need to scrap the gridded stampings.
The two curves in Fig. 3 provide even more information. If the curves encompass the exact same locations on each end of the bumper, the area under the curves represents the average stretch in that area. The increased area under the driver-side curve indicates more stretch. However, the geometry of the two bumper ends is symmetrical and the amount of stretch should be equal. Therefore, the increase in the driver-side stretch probably originated from more restraint at the blank end. Less movement of binder material into the die requires a higher level of localized stretch. An off-center blank, less punch-die clearance, differential lubrication, a non-parallel press, varying lengths of cushion pins and other problems come to mind.
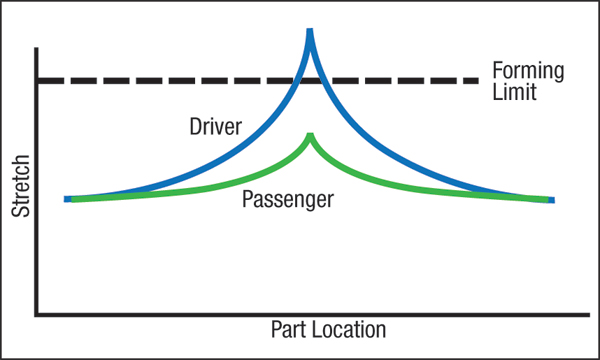 |
| Fig. 3—Driver end of the bumper encountered sporadic necks and tears. |
To reduce the list of potential causes, an engineer can conduct this simple test, if the die allows: Rotate the die 180 deg. within the press and if the problem rotates with the die, die variables are suspect. If the problem stays on the same side of the press, press variables are targets for closer evaluation.
Same Conversation, Different Stampings
Our stamped-bumper project received an unexpected troubleshooting opportunity when the identical bumper was manufactured at a second stamping plant. Engineers at the second plant obtained data for three different bumper depths, and were surprised by the shape of the stretch distributions (Fig. 4). Instead of the peaked stretch distribution found at the first stamping plant, bumpers from the second plant contained flat stretch distributions. While peaked distributions can increase or decrease in height as input variables change, flat stretch distributions tend to be immune to changes in these variables.
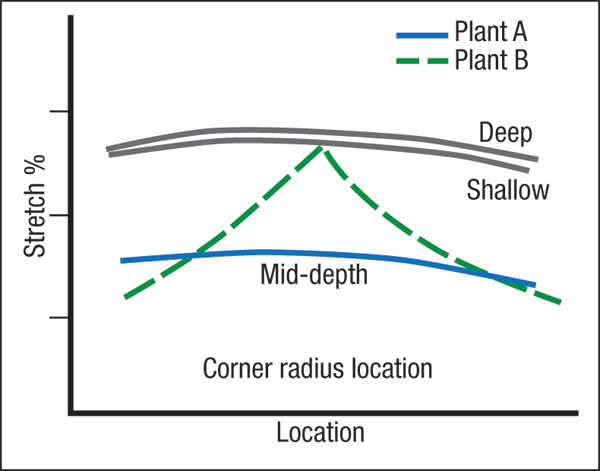 |
| Fig. 4—Plant A bent the bumper steel around the corner, while Plant B stretched the steel. |
In addition, no correlation was obtained between bumper depth and level of stretch. The two upper flat curves in Fig. 4 were for the deepest and shallowest bumpers. The lowest stretch level was found in the mid-depth bumper.
The most important question: Why did one plant create bumpers with a peaked stretch while the other plant generated flat stretch gradients? Instead of pulling on the end of the blank to create a stretch condition, the die used at the second plant was designed with bending as the primary forming mode. The outer convex stretch for a bend is proportional to the bend radius and sheet thickness. By keeping the bend radius constant, the surface stretch remained constant as shown in Fig. 4. MFView Glossary of Metalforming Terms
Technologies: Quality Control
Comments
Must be logged in to post a comment. Sign in or Create an Account
There are no comments posted. Quality Control
Amrol Jr. New Starrett President and CEO, Other Executives N...
Wednesday, March 5, 2025
Ascential Technologies Appoints Divisional CEO to Specialty ...
Wednesday, April 24, 2024
 Materials
Brinell, Rockwell and Vickers Hardness Testing: Use and Misu...
Daniel Schaeffler Friday, April 1, 2022
Quality ControlTroubleshooting Sheet Metal Forming Problems, Part 2: The St...
Daniel Schaeffler Friday, February 26, 2021