Stuart Keeler Stuart Keeler
President/owner

n and m Values Are Important When Forming

September 1, 2017
0
Comments


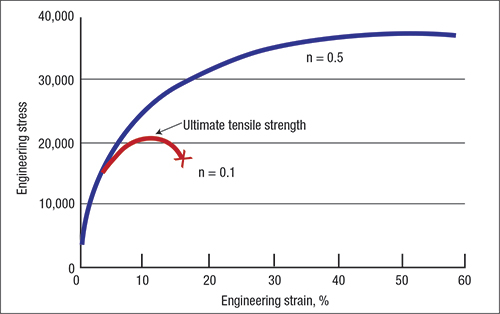
Fig. 1—Standard stress-strain curves allow n values to be obtained.
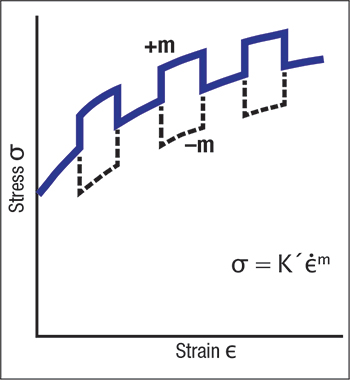
A look back over most of metalforming history shows a dependency on traditional yield-strength, tensile-strength and total-elongation values. To obtain this data, a machined tensile sample is placed between two jaws of a tensile-test machine and the sample is stretched until it breaks. Current test machines use electronic load cells and extensometers to trace out graphs showing stress versus strain. The engineering stress-strain curve shows for each increment of deformation the corresponding stress increase due to workhardening. The traditional graph has four distinct stages: yield strength, uniform elongation, UTS and total elongation.

In Fig. 1, two stress-strain curves illustrate the effect of n values. The following equation is used to describe the stress-strain curves:

σ = Kεn

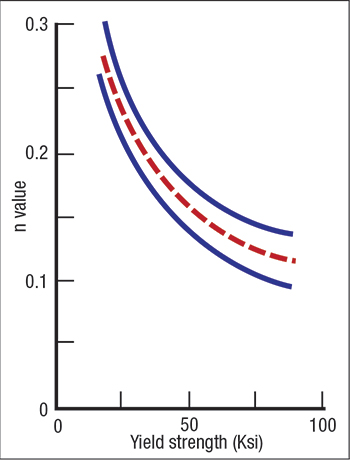
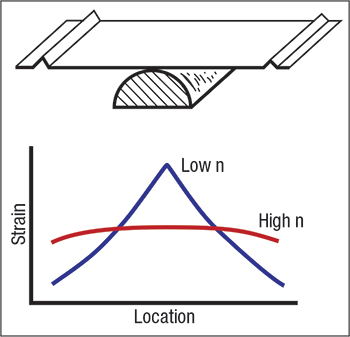
Fig. 2—Higher yield stress will cause major reductions in the n value. Fig. 3—High n values greatly reduce sharp bends.
The n value describes the workhardening of the metal or the steepness of the stress-strain curve. The tensile-strength/yield-strength ratio is related to the n value and the uniform elongation. Higher n values create higher engineering stress and strain curves.

Nature does not provide something for nothing, as Fig. 2 shows. Techniques to strengthen steel by increasing the yield stress also reduce n values. Coldworking is the worst method to strengthen steel.

In Fig. 3, the sheet at the top of the figure will be end-locked and bent over the half-round die. A low-n-value steel will generate a center kink in the bend. The high-n-value steel will emerge with a smooth uniform shape.


Fig. 4—Increasing the forming speed during an m test will indicate a material’s reaction to forming speed.Fig. 5—Negative m values generally are found in nonferrous alloys.
The strain-rate-hardening exponent (m) determines how the flow stress changes as deformation speed changes. Fig. 4 illustrates the entire output. A sample in the tensile-test machine begins elongation at a specific speed. Then the test speed is increased and returned to normal speed several times, and the stress record is examined. If the stress is above normal, the material has become stronger. This is important in designing and constructing automobiles and most other items. If the stress drops below the average line, the sheetmetal became weaker.

Fig. 5 illustrates the difference between two different alloys. This information can be extremely important when designing and building automobiles, planes and any other item that depends on strength. For example, in a high-speed crash the aluminum would become softer and less protective. The steel, however, would get stronger than the normal driving strength.

Gathering n and m information for various materials and applications is a great help in our fast-growing technical world. MF


Industry-Related Terms: Forming, Alloys, Center, Die
View Glossary of Metalforming Terms

Technologies: Management, Materials

Comments

Must be logged in to post a comment.
There are no comments posted.

Subscribe to the Newsletter

Start receiving newsletters.