Stuart Keeler Stuart Keeler
President/owner

Stress-Strain Curves Give Visual Clues About Formability

July 1, 2015
0
Comments


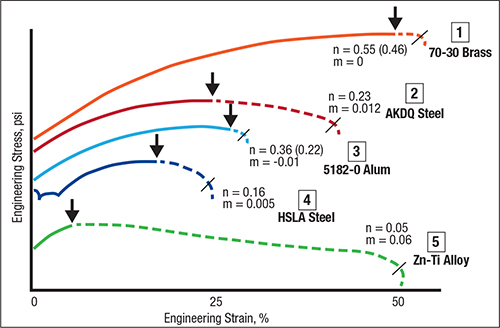
You need a quick formability comparison for five different metal alloys. The five tensile tests have just been completed and the engineering stress-strain curves are available, but not the numerical data. You must make a judgement about the n-value, m-value, forming-limit curve (FLC) and total elongation using the shape of the curve.

Six areas of the stress-strain curve can provide information about material formability
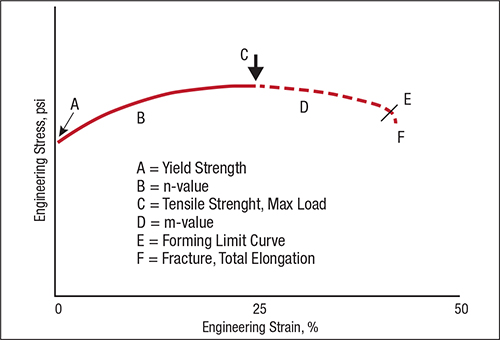
Fig. 1—Six areas of the stress-strain curve can provide information about material formability.
Fig. 1 identifies the typical six zones of importance. Point A defines the material’s initial yield strength. Section B of the stress-strain curve, a function of the n-value, derives from the equation σ σ = K??n. For a discussion on n-value, see The Science of Forming column in the May 2015 issue of MetalForming.

Point C on the stress-strain curve is where we measure ultimate tensile strength, maximum load, uniform elongation and the onset of the diffuse neck. Section D of the stress-strain curve (dashed line in Fig. 1) is important to nonferrous materials such as aluminum and copper alloys. Once the tensile-test specimen initiates the diffuse (width) neck, the stress in the specimen begins to decrease and deformation outside of the neck stops. The speed of forming within the diffuse neck increases to compensate for the loss of deformation in the zones outside the neck. This speed increase causes strain-rate hardening defined by the m-value, which parallels the n-value equation:

Strain hardening (n-value): σσ = K??n

Strain-rate hardening (m-value): σσ = Kέm

Measure m-value by increasing and then decreasing the speed of a tensile test by a factor of 100. The direction of the stress change provides the magnitude and direction (positive, zero, negative) of the stress change.
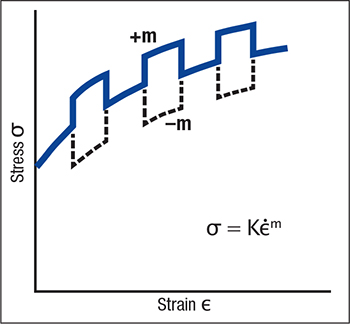
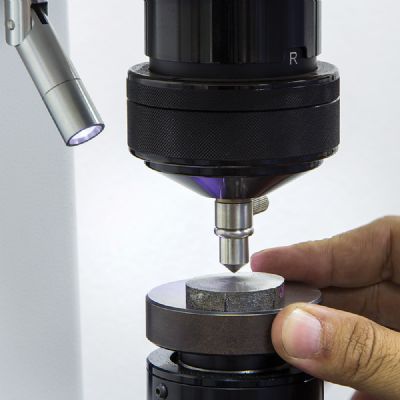
Fig. 2—Measure m-value by increasing and then decreasing the speed of a tensile test by a factor of 100. The direction of the stress change provides the magnitude and direction (positive, zero, negative) of the stress change.
The n and m parameters have different constraints—n-value always is positive. The deformation created by the n-value can be reversed only by annealing the sheetmetal. The m-value can be positive, zero or negative. A change in stress due to a change in strain rate will be cancelled when the deformation speed returns to its initial value (Fig. 2). A positive m-value causes the stress to increase at that location and resist deformation. A high m-value reacts similarly to a high n-value in preventing the formation of gradients (high values of narrow localized strain). Zero m- and n-values do not affect deformation.

A negative m-value can have a disastrous effect on local deformation. As soon as the negative m-value starts to reduce the stress at a given location, the rate of local deformation increases and a gradient develops. The deformation rate in the gradient increases and the m-value becomes more negative. A chain reaction occurs that rapidly initiates a tear in the stamping, especially from the cut edges. There is no D portion of the stress-strain curve—the diffuse neck tears almost immediately with the total elongation restricted to the uniform elongation.

Ferrous alloys are treated differently. Steel m-values always are positive and research shows them to be proportional to n-value. Therefore only n-value data are commonly measured and recorded to evaluate stretchability.

To complete the Fig. 1 identifications, Point E represents the onset of the local (through-thickness) neck that identifies the start of the FLC. Point F is fracture and the measurement point for total elongation.

Fig. 3 presents five stress-strain curves, each one for a different material. The curves are shown vertically according to uniform elongation, rather than the traditional yield-strength sequence to make them easier to understand. Based on previous information, evaluate the shape of each curve and try to estimate high or low values of n and m.

The relationship between n-value (the solid line) and m-value (the dashed) during a simple tensile test can reveal much about material formability. Graphs from A.H. Ghosh, Transaction ASME 1977.
Fig. 3—The relationship between n-value (the solid line) and m-value (the dashed) during a simple tensile test can reveal much about material formability. Graphs from A.H. Ghosh, Transaction ASME 1977.
Curve 1 (70-30 brass): The n-value region, extremely long, indicates a high n-value. The very-short m-value region indicates a zero or negative value. Measured values: n-value = 0.55 initial, 0.46 average for the entire curve. This alloy has n-values in the same range as highly stretchable austenitic stainless steel. The m-value is zero.

Curve 2 (aluminum-killed draw-quality (AKDQ) steel: The n-value (0.23) and m-value (0.012) are positive and high.

Curve 3 (5182-O aluminum): This material has an n-value of 0.36 (0.22), approximately the same as for AKDQ steel, and a zero or negative m-value (-0.01 here).

Curve 4 (high-strength low-alloy steel: These steels are expected to have lower n- and m-values because they decline as the steel’s yield strength increases. Here, n-value is 0.16, m-value is 0.005.

Curve 5 (Zn-Ti alloy): The curve shape indicates a low n-value (0.05) and a very high positive m-value (0.06).

Like curve 5, a sample of superplastic aluminum has an extremely high 0.5 m-value. A tensile sample with a 0.505-in.-dia. round cross-section was heated and slowly elongated in a tensile-test machine. The test ended when the sample had elongated 3000 percent and was reduced to the diameter of a human hair. After researchers completed their measurements, additional elongation was obtained. A material with a high positive m-value is excellent, while a zero or negative m-value can be disastrous. Many companies continue to search for ways to convert m-values from negative to positive. For example, warm forming has proven successful with certain aluminum grades. MF
Industry-Related Terms: Alloys, Austenitic Stainless Steel, Forming, Point, Stainless Steel, Tensile Strength
View Glossary of Metalforming Terms

Technologies: Quality Control

Comments

Must be logged in to post a comment.
There are no comments posted.

Subscribe to the Newsletter

Start receiving newsletters.