Stuart Keeler Stuart Keeler
President/owner

Use Raw DataAverages Lose Information

January 1, 2012
0
Comments


We all love to average data. A friend recently said that he averaged 65 miles/hr. on his last trip, affectively hiding the many miles driven well above the speed limit to compensate for driving slowly through a construction zone and stopping to replace a flat tire. While an average is easy to use in a report or conversation, an average often (intentionally or not) hides critical information needed to understand the scope of a problem, and masks possible avenues for troubleshooting.

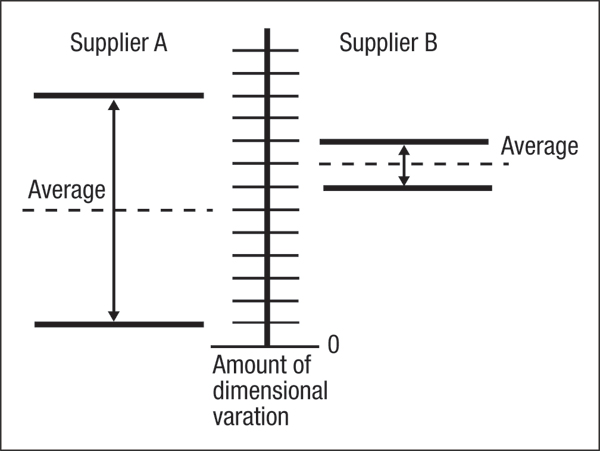
Dimensional variation for Supplier B can be reduced by press or die modifications. Supplier A must attack process variations before lowering the average variation.
Consider two press shops supplying the same part to XY Company. The average dimensional deviation from spec for all parts made by supplier A is less than that for supplier B, giving supplier A bragging rights—until XY Company fires them. This puzzles supplier A, until seeing the raw data (in the illustration) showing that while its average deviation was lower than that for supplier B, its deviation was huge. Average deviations usually can be corrected though adjustments to the tooling or press, which would allow supplier B to make the required changes and supply parts with accurate and stable dimensions. For supplier A to do the same, it would have to conduct a detailed study to determine the source of dimensional variation and then implement major process changes, since stamping variation often results from two or more input variables.

Another example of how data averages hits issues in the press shop: CAD computation of increase in lengths of line (LOL), measured at various locations along the stamping surface between die radii. Comparing this with the original LOL available to make the part generates percent stretch. Using only two measurements—final and original LOL—provides only an average of the stretch along the line. However, in most stampings the material does not stretch uniformly, and many areas will exhibit percent stretch well above and below average. Areas of high stretch could be ready to fail, and so this is the information needed for troubleshooting, not averages.

One more example: percent scrap rate, often calculated by counting the number of defective or rejected stampings tossed into a scrap bin at the end of a run. Dividing the number of scrapped parts by the total number of stamped parts made generates an average percent scrap rate for the run. Another method used is to draw a line on a marker board for each stamping scrapped, count the number of marks and divide it by the total number of stampings produced. Other companies use parts per million (PPM) as a measure of average scrap rate. Regardless of the measurement process, the average scrap rate provides little useful information for troubleshooting or process correction.

Test Your Troubleshooting Acumen

One simple change can transform these averages into useful raw data. Rather than counting parts in a bin or making line marks on a chart board, write on the chart board the time of day that each scrapped stamping was produced. This raw data defines the history of producing scrap during a run, and often we find that the cause of the rejection leaves an identifying historical pattern. The following exercise illustrates this troubleshooting technique.

Assume a 5-percent scrap rate accumulated over a continuous run of four shifts. The time of each rejected stamping is recorded, and at the end of each run the times are analyzed for patterns. Here we list common rejection patterns and their likely causes—see how well you can match each rejection pattern to the likely root cause. (Answers appear on the next page.)


Rejection patterns noted from time logs

1) All rejections from one coil of steel

2) Rejections immediately after lunch break, shift change or long down time

3) All rejections on midnight shift

4) All rejections after die transition

5) All rejections after die was tweaked

6) One or two rejects throughout the run


Logical Root Cause

A) Ground-down draw bead

B) Did not have a “Bernie” book

C) Substitute press operator

D) Spot buy of steel (at great price)

E) Drop in die temperature

F) System on edge of deformation cliff

(An obvious question: What is a “Bernie” book? Bernie was the supervisor of die transition at a large Tier One stamping plant. All die transitions were done on the third shift. Bernie’s book contained all of the die and press-line settings for every die set in the home press line. Included were allowable blank thicknesses, blank gauge settings, lubricant type and thickness, press shut heights, tonnage-monitor values and other key variables. Wherever possible, complete settings also were recorded for the assigned backup press line if the home press line was unavailable. The book was written in pencil to allow the insertion of revised numbers if the die was modified or the press underwent maintenance. If Bernie went on vacation or was sick, the book was als available in his office for others to use. The plant’s first required troubleshooting instruction: “If you do not know exactly what changed, then return all settings back to the transition settings in Bernie’s book.” The very last instruction: “Now you may pick up the grinder, with the permission of the shift manager.” No mention was made about about average values; only extensive raw data was needed to run an excellent press shop.) MF


Answers: 1-D, 2-E, 3-C, 4-B, 5-A, 6-F

Industry-Related Terms: CAD, Die, Draw, Edge, Gauge, Run, Scrap, Surface, Thickness, Blank
View Glossary of Metalforming Terms

Technologies: Quality Control

Comments

Must be logged in to post a comment.
There are no comments posted.

Subscribe to the Newsletter

Start receiving newsletters.