


How Reliable are Your Test Results?
August 1, 2011Comments
Conducting tests forms the foundation of science, engineering, education and press shops. We conduct tests to obtain answers to questions, to troubleshoot, and to satisfy spurts of curiosity. Most often, these tests are carefully planned, well constructed, cautiously run and honestly analyzed. Sometimes, however, incorrect answers result because one or more rules of experimentation were overlooked. Let’s review some actual tests gone wrong.
• Laser welding, gaining popularity in many industries, generates a narrow weld and heat-affected zone compared to arc-welding processes. In one case, a study was conducted to evaluate stretching degradation when butt welding two pieces of steel of different thicknesses. To evaluate weld stretchability, the metalformer clamped a series of welded blanks using a variety of material-thickness combinations, and stretched the blanks using a 4-in.-dia. hemispherical punch. The weld line was centered over the pole of the punch.
(Data reported here are illustrative and should not be used for any other purpose.)
The relative sheet thicknesses: 1.0, 0.9, 0.8 and 0.7 as proportional to the thickest sheet. The as-received sheet also was tested without any welds.
The study concluded that using even small step welds greatly reduced the stretchability of all laser welds. Unfortunately, a key measurement was not reported: The largest reduction in weld stretchability occurs when two cut edges are welded, even without a change in thickness. Lacking this measurement, no valid measure of damage due to step welds can be made. However, since we know the large reduction in edge stretchability caused by shear cutting the blank edges, the stretchability of welds in equal-thickness sheets likely will be around 85 percent. The added increment of creating a step edge most likely is small. Weld Combination Stretchability
Non-welded sheet
100 percent
1 to 0.9 ratio
82 percent
1 to 0.8 ratio 79 percent 1 to 0.7 ratio 76 percent
Lessons learned: Be sure to include all variables. Do not overlook the obvious but unseen. Ask two or three experts from another field to review your test plans, your work and your conclusions.
• A fatigue study of wheel rims showed a significant difference in fatigue life between two types of steel. After studying metallurgical samples and conducting tests on composition and tensile properties, no difference between the two steels could be identified. Then someone reviewed the shipping papers for the steels and found that, although the orders were identical; the steels were shipped with different thicknesses. Steel 1 was thinner. Since fatigue life is a function of the fourth power of thickness, the thinner steel exhibited a much lower fatigue life. When the test results were corrected to the same steel thickness, steel 1 had the longer life. Lessons learned: Back-engineer your tests. Find out what variables are significant in the final result, then be sure to include them as test variables.
• The relative rate of aging for two types of steel was measured by Olsen tests. These 1-in.-dia. dome-stretch tests recorded maximum dome height at the onset of failure. Tests were performed in an automatic machine to eliminate operator error/bias. Tested were steel 1 (an aging steel) and steel 2 (a non-aging steel). Test results showed the non-aging steel aged more than the aging steel—an unlikely result. Examining the test procedures, it was found that steel 1 samples were prepared the day before testing and were tested at the start of work the next day, while steel 2 samples were prepared and tested after lunch of test day. Once started, the hydraulics of the test machine ran all day.
Examining the test machine revealed that the operating temperature of the machine was higher after lunch than during morning startup. The hot hydraulic oil heated the punch and reduced the viscosity of the test-piece lubricant. The hot hydraulic oil also caused the afternoon tests to be run at faster speeds, so valid test comparisons were not being made. Lesson learned: Mix the sets of samples into random sequence for testing, so that equal numbers of sample pairs will be exposed to the same test environment independent of time of test.
• Coefficient of friction (COF) tests are conducted routinely to study the relationships between three key components—lubricant, sheetmetal surface and tooling material (see the figure). When testing one component, the other two must remain constant—often a difficult restriction to meet. For example, sheetmetal can change throughout the coil, so a group of samples can vary. Or, the tool can wear during the test, or become contaminated by dirt.
Therefore, one must arrange a random matrix of all of the lubricant samples being tested that day, allowing each different lubricant to be evaluated for all changing conditions. Have more samples to test the next day? Technically, COF values from the second day cannot be mixed with the values obtained during the first day of testing, although some measure of comparison can be achieved if several reference samples are measured each day. Even here, the question arises whether storage of those samples have changed them. 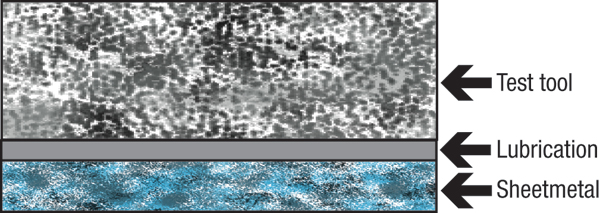
When testing one of three components, the other two must remain constant.
View Glossary of Metalforming Terms
Technologies: Quality Control
Comments
Must be logged in to post a comment. Sign in or Create an Account
There are no comments posted. Quality Control
Amrol Jr. New Starrett President and CEO, Other Executives N...
Wednesday, March 5, 2025
Ascential Technologies Appoints Divisional CEO to Specialty ...
Wednesday, April 24, 2024
 Materials
Brinell, Rockwell and Vickers Hardness Testing: Use and Misu...
Daniel Schaeffler Friday, April 1, 2022
Quality ControlTroubleshooting Sheet Metal Forming Problems, Part 2: The St...
Daniel Schaeffler Friday, February 26, 2021