Adding Capacity Rate to the OEE Equation
May 1, 2010Comments
To support its supplier, F&P America, Hondas North American Technical Group developed a new equation for measuring overall equipment effectiveness, and testifies that effective problem solving starts with a strong data-collection system.
Managing a stamping department has become more difficult than ever. As auto production has plummeted, we (automotive-parts supplier F&P America) have been faced with significant profitability pressures that have forced us to increase efforts to reduce waste. While past practices were sound and enabled us to find and solve many issues, we’ve elevated our efforts to take waste reduction to the next level. That has meant identifying and solving even the smallest of issues.
Our solution was to brainstorm and develop an internal OEE (overall equipment effectiveness) tracking system that allowed us to identify the key components of OEE: performance rate (PR), quality rate (QR) and operating rate (OR). The key goals of the tracking system were:
• Eliminate production sheets;
• Support web-based local and near-real-time input by operators;
• Provide standard visual graphs/ reports; and
• Provide OEE details (OR, PR and QR).
To ensure that the new OEE tracking system would be used and prove effective, a team of associates, team leaders and supervisors worked together to guide its creation. The system was launched early in 2009.
Creating an Effective Visual Output
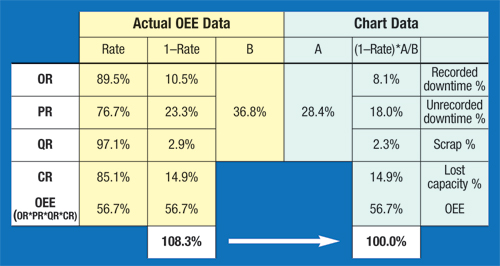
A critical goal for the tracking system was to create simple and effective visual outputs. As a result, the team developed a new, more meaningful method of displaying OEE (Fig. 1).
We achieved the chart by combining, as a ratio, the inverse of OR, PR and QR with OEE to form a stacked bar that visually represents 100-percent efficiency.
 |
| Fig. 1—A new, more meaningful method of displaying OEE combines, as a ratio, the inverse of OR, PR and QR with OEE to form a stacked bar that visually represents 100-percent efficiency. |
The chart allows a very simple trend analysis of PR, OR, QR and OEE over days, weeks or months. Its simplicity makes it easy for all associates to understand. Other benefits with the system include standardized and consistent detailed downtime codes, a variety of graphs to support trend analysis, and pareto charts to show critical downtime items.
F&P America spent several months fine-tuning the system, training operators and developing the methodology for using this information to improve overall OEE.
The stamping department had experience with OEE and so associates quickly learned to use each component. Initial PR calculations identified lost time in excess of 20 percent, larger than expected, and press operators were asked to identify the reasons for so much lost time. We developed and implemented OEE training programs for the operators, and they were tasked with recording all downtime and with reducing lost time. Asking the operators to identify the reasons for lost time, we found, increased their awareness of and their contribution to avoiding lost time. These initial efforts resulted in a modest reduction in lost time.
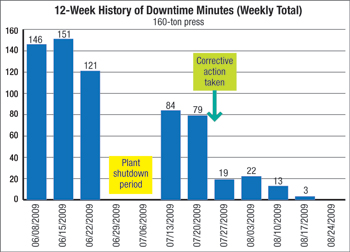 |
| Fig 2—Other benefits with the new OEE system include standardized and consistent detailed downtime codes, a variety of graphs to support trend analysis, and pareto charts to show critical downtime items. One key output graph is a standard 12-week downtime-code history graph such as that shown here for a 160-ton press, tracking how often parts would intermittently fall off of and jam the conveyor and cause unplanned downtime. In this case, the graph helped verify that the developed and implemented corrective action proved effective. |
To make more of an impact, we decided to outfit the presses to allow us to electronically log press operations and to track stoppages. Operators then could use this information to identify all downtime. We wired a stopwatch-type device into the PLC of the presses that would run any time that a press stopped. These stoppages were displayed for each operator to see and use when entering downtime into the OEE system at each press. The result was a lost-time reduction of 2 to 3 percent, and improved downtime-logging accuracy.
As we sliced the data by press, part, shift, downtime code and other variables, we identified many previously unrecognized issues. For example, at a 160-ton press, parts would intermittently fall off of and jam the conveyor, causing unplanned downtime. Being intermittent, it wasn’t deemed a severe problem, but when downtime was measured over a month of production, it actually made the top-10 list of downtime causes for the plant.
One key output graph we designed was a standard 12-week downtime-code history graph. This graph (Fig. 2) allows anyone in the plant to review the trend of a particular downtime. In this case, we used the graph to verify that the developed and implemented corrective action proved effective.
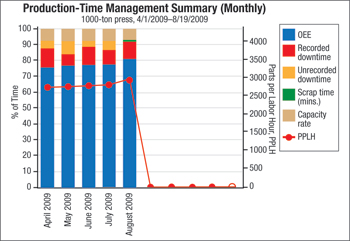 |
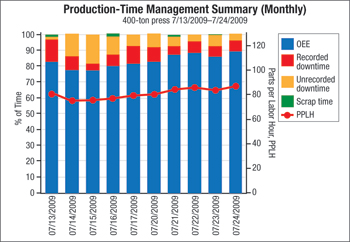
| Fig. 3—New time-management summaries now feature capacity rate (CR)—the ratio of actual cycle time to machine maximum-SPM cycle time—and integrate CR into the existing stacked bar chart. As a result of this new charting, OEE activity now includes an SPM improvement plan focused on reducing lost capacity and increasing CR. |
At some point, the ability to increase OEE starts to become limited by fixed downtime events such as coils changes and die changes, and a certain amount of random downtime events. Of course, that didn’t stop F&P America’s president from pushing for more cost and manpower reductions. That pressure led us to reevaluate the press stroke rate for our dies, taking a close look at run rate based on die size, steel thickness and other variables. Initially, we judged OEE against a defined part-specific press rate, not against a press’s maximum stroke rate.
Consider, for example, a 1000-ton press with a manufacturer’s rating of 60 strokes/min (SPM). Since not all parts can run at 60 SPM, we essentially have lost capacity (similar to lost time related to PR). So, a part running at 45 SPM has 25-percent lost capacity. Note also that increasing SPM from 45 to 60 represents a 33-percent increase. That is a significant capacity boost, and you get it for free.
Taking all of this into consideration, we needed a to mathematically capture this on a part-by-part basis. The first solution was to simply change all of the cycle times in the system to be based on 60 SPM. While that does work, in the traditional OEE formula that loss shows up as PR (lost time). For example, if the 45-SPM part had 3-percent lost time before the change, after the change it would be around 28 percent. When that happens, the associates can no longer use PR as a measuring stick and the actual lost time creeps up.