
Page 106 - MetalForming October 2015
P. 106
The Science of Forming
By Stuart Keeler
A Shortcut for Assessing Forming Severity
The forming-limit curve (FLC) turns 50 years old this year. Last month we reviewed some problems encountered when using the FLC to predict metalforming failure. While the appli- cation details may vary, the basic analysis steps remain the same.
1) Apply a circle grid or other strain-tracking process to the surface of the stamping. These markings will determine strain direction, mag- nitude and gradient at desired locations, in real or virtual stampings.
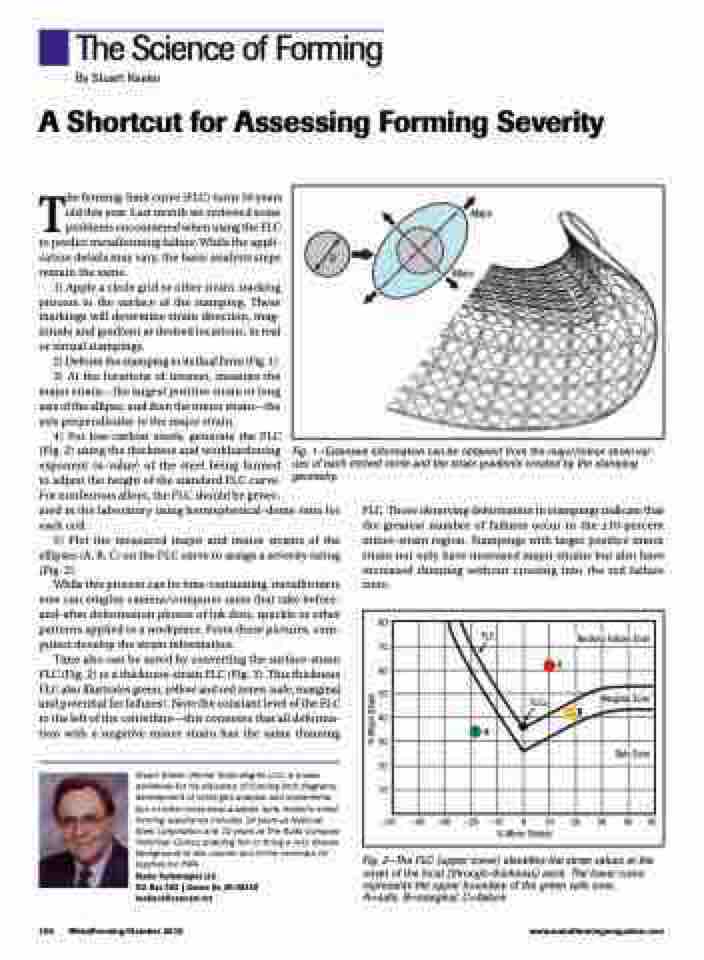
2) Deform the stamping to its final form (Fig. 1).
3) At the locations of interest, measure the major strain—the largest positive strain or long axis of the ellipse, and then the minor strain—the axis perpendicular to the major strain.
4) For low-carbon steels, generate the FLC
(Fig. 2) using the thickness and workhardening
exponent (n-value) of the steel being formed
to adjust the height of the standard FLC curve.
For nonferrous alloys, the FLC should be gener-
ated in the laboratory using hemispherical-dome tests for each coil.
5) Plot the measured major and minor strains of the ellipses (A, B, C) on the FLC curve to assign a severity rating (Fig. 2).
While this process can be time-consuming, metalformers now can employ camera/computer units that take before- and-after deformation photos of ink dots, spackle or other patterns applied to a workpiece. From these pictures, com- puters develop the strain information.
Time also can be saved by converting the surface-strain FLC (Fig. 2) to a thickness-strain FLC (Fig. 3). This thickness FLC also illustrates green, yellow and red zones (safe, marginal and potential for failures). Note the constant level of the FLC to the left of the centerline—this connotes that all deforma- tion with a negative minor strain has the same thinning
Stuart Keeler (Keeler Technologies LLC) is known worldwide for his discovery of forming limit diagrams, development of circle-grid analysis and implementa- tion of other press-shop analysis tools. Keeler’s metal- forming experience includes 24 years at National Steel Corporation and 12 years at The Budd Company Technical Center, enabling him to bring a very diverse background to this column and to the seminars he teaches for PMA.
Keeler Technologies LLC
P.O. Box 283 | Grosse Ile, MI 48138 keeltech@comcast.net
D
Major
Minor
Fig. 1—Extensive information can be obtained from the major/minor strain val- ues of each etched circle and the strain gradients created by the stamping geometry.
FLC. Those observing deformation in stampings indicate that the greatest number of failures occur in the ±10-percent minor-strain region. Stampings with larger positive minor strain not only have increased major strains but also have increased thinning without crossing into the red failure zone.
80 70 60 50 40 30 20 10
–50 –40 –30 –20 –10 0 10 20 30 40 50 % Minor Stretch
FLC
Necking Failure Zone
C
FLC0
Marginal Zone
B
A
Safe Zone
104 MetalForming/October 2015
www.metalformingmagazine.com
Fig. 2—The FLC (upper curve) identifies the strain values at the onset of the local (through-thickness) neck. The lower curve represents the upper boundary of the green safe zone. A=safe, B=marginal, C=failure
% Major Strain
