
Page 20 - MetalForming October 2012
P. 20
Best Practices
By Bob Dobrowsky
Employee Turnover: A Key Ratio to Monitor
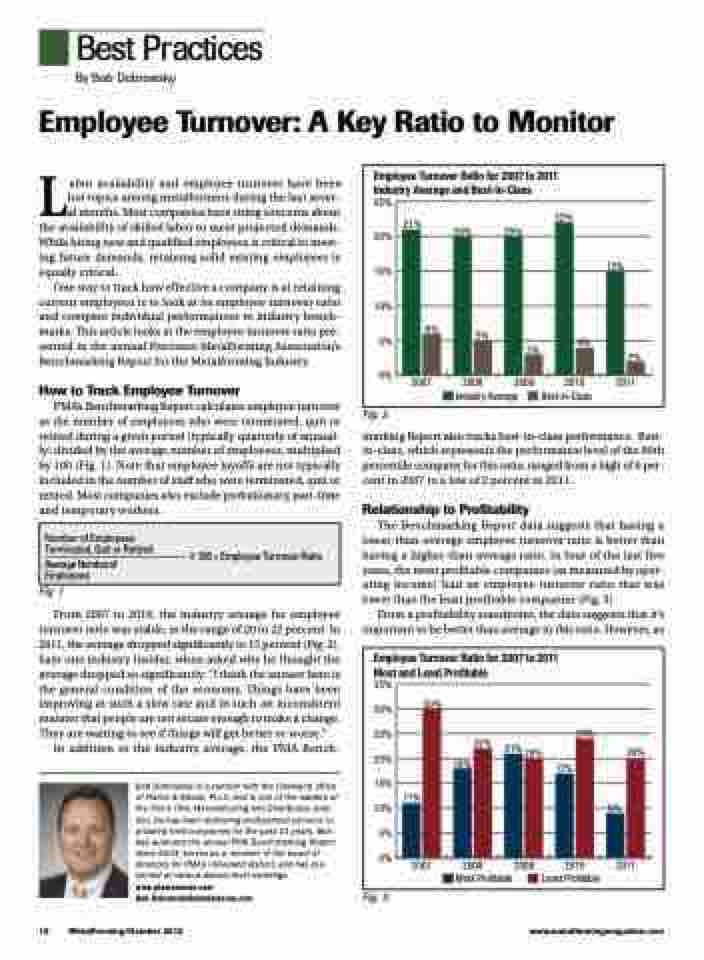
Employee Turnover Ratio for 2007 to 2011 Industry Average and Best-in-Class
25%
21% 20%
22%
20% 20%
6%
5%
3%
4%
15% 10% 5% 0%
15%
2%
2007
2008 2009 2010 2011 Industry Average Best-in-Class
Labor availability and employee turnover have been hot topics among metalformers during the last sever- al months. Most companies have rising concerns about the availability of skilled labor to meet projected demands. While hiring new and qualified employees is critical to meet- ing future demands, retaining solid existing employees is equally critical.
One way to track how effective a company is at retaining current employees is to look at its employee turnover ratio and compare individual performances to industry bench- marks. This article looks at the employee turnover ratio pre- sented in the annual Precision Metalforming Association’s Benchmarking Report for the Metalforming Industry.
How to Track Employee Turnover
PMA’s Benchmarking Report calculates employee turnover as the number of employees who were terminated, quit or retired during a given period (typically quarterly of annual- ly) divided by the average number of employees, multiplied by 100 (Fig. 1). Note that employee layoffs are not typically included in the number of staff who were terminated, quit or retired. Most companies also exclude probationary, part-time and temporary workers.
Fig. 1
From 2007 to 2010, the industry average for employee turnover ratio was stable, in the range of 20 to 22 percent. In 2011, the average dropped significantly to 15 percent (Fig. 2). Says one industry insider, when asked why he thought the average dropped so significantly: “I think the answer here is the general condition of the economy. Things have been improving at such a slow rate and in such an inconsistent manner that people are not secure enough to make a change. They are waiting to see if things will get better or worse.”
In addition to the industry average, the PMA Bench-
Bob Dobrowsky is a partner with the Cleveland office of Plante & Moran, PLLC, and is one of the leaders of the firm’s Ohio Manufacturing and Distribution prac- tice. He has been delivering professional services to privately held companies for the past 21 years. Bob has authored the annual PMA Benchmarking Report since 2003, serves as a member of the board of directors for PMA’s Cleveland district, and has pre- sented at various district level meetings. www.plantemoran.com
Bob.Dobrowsky@plantemoran.com
Fig. 2
marking Report also tracks best-in-class performance. Best- in-class, which represents the performance level of the 90th percentile company for this ratio, ranged from a high of 6 per- cent in 2007 to a low of 2 percent in 2011.
Relationship to Profitability
The Benchmarking Report data suggests that having a lower-than-average employee turnover ratio is better than having a higher-than-average ratio. In four of the last five years, the most profitable companies (as measured by oper- ating income) had an employee turnover ratio that was lower than the least profitable companies (Fig. 3).
From a profitability standpoint, the data suggests that it’s important to be better than average in this ratio. However, as
Number of Employees
Terminated, Quit or Retired
——————————–—––—— x100=EmployeeTurnoverRatio Average Number of
Employees
Employee Turnover Ratio for 2007 to 2011 Most and Least Profitable
35% 30% 25% 20% 15% 10%
5% 0%
30%
11%
18%
22%
21% 20%
17%
9%
24%
20%
2007
2008 2009 Most Profitable
2010 2011 Least Profitable
18
MetalForming/October 2012
www.metalformingmagazine.com
Fig. 3
